News

HOUSTON, Texas – Plunkett Research, Ltd. recently announced an important market research and competitive analysis report, Plunkett’s Consulting Industry Almanac, 2016 edition. A complete market research report, including forecasts and market estimates, technologies analysis and developments at innovative firms.

Global consulting industry revenues (including HR, IT, strategy, operations, management and business advisory services) will be about $470 billion in 2016, according to Plunkett Research estimates. The consulting industry experienced a slowdown after the 2008-2009 recession, but rising profits means major consulting companies, are seeing a rise in business from corporate clients. The same cannot be said for the government sector where intense budgetary scrutiny has been particularly hard on some consulting firms.

Key Findings:

  • Plunkett Research lists 250 companies in Consulting and names top trends changing the industry for the mid term.

Available Formats:

  • Printed Almanac: ISBN 978-1-62831-396-3 (Available Now)
  • E-book: ISBN 978-1-62831-729-9 (Available Now)
  • Online Subscription

Key Features Include:

  • Industry trends analysis, market data and competitive intelligence
  • Market forecasts and industry statistics
  • Industry associations list
  • Profiles of leading companies

Pages: 383             

Statistical Tables Provided: 5

Companies Profiled: 257

Geographic Focus: Global

Price: $349.99

Key Questions Answered Include:

  • How is the industry evolving? 
  • How is the industry being shaped by new technologies? 
  • How is demand growing in emerging markets and mature economies?
  • What is the size of the market now and in the future?
  • What are the financial results of the leading companies?
  • What are the names and titles of top executives?

This feature-rich book covers competitive intelligence, market research and business analysis—everything you need to know about the consulting business including:

  1. Introduction to the Consulting Industry
  2. Management Consulting and Consulting to Major Corporations
  3. Consulting to Governments/U.S. Federal and State Consulting Contracts
  4. IT Consulting/Software Consulting/Computer Operations Consulting
  5. Trends in Manufacturing, such as Original Design Manufacturers (ODMs), Lead to
  6. Collaboration and Consulting-Like Services
  7. Consulting Firms Accept Assignments with Contingency Fees
  8. Accounting Firms Taking Large Market Share of Consulting Contracts
  9. Many Industry Sectors Seek Consulting and Outsourcing Income, Competing with Pure
  10. Consultancies
  11. Major Corporations and Organizations Develop Internal Consultants and Seek Outside Clients
  12. Corporate Clients Want Solid Returns on IT Investments
  13. Federal Government Consulting Is Curtailed in Some Agencies as Part of Budget
  14. Austerity and Defense Cutbacks
  15. Offshoring to India Drives Changes in Global Consulting
  16. New MBAs Desire Consulting and Accounting Jobs

Consulting Industry Statistics

  1. Consulting Industry Statistics and Market Size Overview
  2. Consulting Industry Revenue & Expenses, U.S.: 2010-2015
  3. Management Consulting Companies: Estimated Sources of Revenue, U.S.: 2010-2014
  4. Environmental Consulting Services Revenue, U.S.: 2007-2014
  5. Consulting Industry Employment, U.S.: 2010-2016

Companies Mentioned Include:

  • Abt Associates Inc
  • Arthur D Little
  • Helios & Matheson Analytics Inc
  • ABB LTD
  • Abelica Global
  • Affiliated Computer Services Inc
  • PA Consulting Group
  • Randstad Holding NV
  • Amey plc
  • Analysts International Corporation
HOUSTON, Texas – Plunkett Research, Ltd. recently announced an important market research and competitive analysis report, Plunkett’s Companion to The Almanac of American Employers Almanac, 2016 edition. A complete market research report, including employer research tips, employment trends and statistics, plus profiles of 500 growing, hiring firms.

Americans who find themselves in the market for a job will need to understand the changes surging through the economy in order to determine which companies to pursue and which to avoid.  The U.S. employment market has evolved dramatically, and job seekers must be both knowledgeable and nimble in order to position themselves to find promising careers.

Key findings:

  • Plunkett Research lists top 500 companies for Mid-Size Employers and names top trends affecting job seekers for the mid term

Available Formats:

  • Printed Almanac: ISBN 978-1-62831-390-1 (Available Now)
  • E-book: ISBN 978-1-62831-723-7 (Available Now)
  • Online Subscription

Key Features Include:

  • Job market trends analysis, data and competitive intelligence
  • Market forecasts and Industry Statistics
  • Important Contacts for Job Seekers
  • In-Depth Profiles of hundreds of leading companies

Pages: 633             

Statistical Tables Provided: 11

Companies Profiled: 513

Geographic Focus: US

Price: $349.99

Research: 7 Keys for Job Seekers

  • Financial Stability
  • Growth Plans
  • Research & Development Programs
  • Product Launch & Production
  • Marketing & Distribution Methods
  • Employee Benefits
  • Quality of Work Factors

This feature-rich book lists the top 500 companies for Mid-Size Employers and names top trends affecting job seekers for the mid term—everything you need to know about the Companion to The Almanac of American Employers including:

  1. U.S. Job Market Overview
  2. Cost Control Remains a Concern at Employers/Consolidation Through Mergers Continues
  3. Unemployment Is Down Substantially Compared to the Recent Past
  4. Consumers Spend Less, Save More than the During Last Boom, Affecting a Wide Variety of Companies
  5. Technology Continues to Create Sweeping Changes in the Workplace
  6. Continued Growth in Outsourcing, Including Supply Chain and Logistics Services
  7. Millions Working as Temps
  8. Offshoring, Reshoring and the Rebound in American Manufacturing
  9. Older Americans Will Delay Retirement and Work Longer/Many Employers Find Older Employees Desirable
  10. Employment Sectors that Will Offer an Above-Average Number of Job Opportunities in 2016

Job Seekers Industry Statistics

  1. U.S. Employment Overview: 2015-2016
  2. U.S. Civilian Labor Force: 1997-2015
  3. Employment by Major Industry Sector: 2004, 2014 & Projected 2024
  4. Number of People Employed and Unemployed, U.S.: December 2014 vs. December 2015
  5. U.S. Labor Force Ages 16 to 24 Years Old by School Enrollment, Educational Attainment,

Sex, Race & Ethnicity: October 2014

  1. Medical Care Benefits in the U.S.: Access, Participation and Take-Up Rates, March 2015
  2. Retirement Benefits in the U.S.: Access, Participation and Take-Up Rates, March 2015
  3. Top 30 U.S. Occupations by Numerical Change in Job Growth: 2014-2024
  4. Top 30 U.S. Occupations by Percent Change in Job Growth: 2014-2024
  5. Occupations with the Largest Expected Employment Increases, U.S.: 2014-2024
  6. Occupations with the Fastest Expected Decline, U.S.: 2014-2024

Research: 7 Keys for Job Seekers

  1. Financial Stability
  2. Growth Plans
  3. Research & Development Programs
  4. Product Launch & Production
  5. Marketing & Distribution Methods
  6. Employee Benefits
  7. Quality of Work Factors

Companies Mentioned Include:

  • Xaxis
  • Premier Inc
  • 1-800 Contacts Inc
  • 1-800-Flowers.com Inc
  • AutoAlliance International Inc
  • ArthroCare Corporation
  • AAMCO Transmissions Inc
  • Denbury Resources Inc
  • EnviroStar Inc
  • Abaxis Inc

HOUSTON, Texas – Plunkett Research, Ltd. recently announced an important market research and competitive analysis report, Plunkett’s Apparel, Textiles, Clothing & Fashions Industry Almanac, 2016 edition. A complete market research report, including forecasts and market estimates, technologies analysis and developments at innovative firms.

While Chinese manufactures have enjoyed a dominant position in shoes, apparel and household textiles manufacturing for several years, lost cost competition and reshoring are putting a dent in China’s dominance of apparel and textile manufacturing. The rise of the fast fashion trend is also reshaping how companies interact with their suppliers and shippers to stay ahead of the competition. On the consumer side of the industry, online shopping platforms, demographic changes, and the renewed interest in athletic wear are shaping the apparel and textiles industry in new and exciting ways.

Key Findings:

  • Plunkett Research lists top 350 companies in Apparel and Textiles and names top trends changing the industry for the mid term.

Available Formats:

  • Printed Almanac: ISBN 978-1-62831-383-3 (Availability Now)
  • E-book: ISBN 978-1-62831-716-9 (Availability Now)
  • Online Subscription

Key Features Include:

  • Industry trends analysis, market data and competitive intelligence
  • Market forecasts and Industry Statistics
  • Industry Associations and Professional Societies List
  • In-Depth Profiles of hundreds of leading companies
  • Industry Glossary
  • Buyer may register for free access to search and export data at Plunkett Research Online
  • Link to our 5-minute video overview of this industry

Pages: 473             

Statistical Tables Provided: 11

Companies Profiled: 345

Geographic Focus: Global

Price: $349.99

Key Questions Answered Include:

  • How is the industry evolving? 
  • How is the industry being shaped by new technologies? 
  • How is demand growing in emerging markets and mature economies?
  • What is the size of the market now and in the future?
  • What are the financial results of the leading companies?
  • What are the names and titles of top executives?

This feature-rich book covers competitive intelligence, market research and business analysis—everything you need to know about the apparel, textiles, clothing & fashions business including:

  1. Introduction to the Apparel & Textiles Industry
  2. Wages Rise in China/Vietnam, Cambodia and Other Countries Gain Manufacturing Market Share
  3. Upswing in U.S. Apparel and Textile Manufacturing Jobs as Firms Reshore
  4. Working Conditions and Workers’ Rights Become Major Considerations as Work Moves from China to Lower-Cost Nations
  5. Exercise Apparel Sales Rise/Athleisure Clothing Sales Soar
  6. 3PL Logistics Services and Supply Chain Management Services
  7. Bricks, Clicks and Catalogs Create Synergies While Online Sales Growth Surges
  8. Plus Sizes Market Evolves to Serve Overweight Consumers
  9. Discount Clothing Retailers See Promise in Designer Lines
  10. Luxury Apparel, Accessories and Consumer Products Lines Compete for Growth
  11. Fast Fashion: Designers and Retailers Speed Up
  12. Designers and Manufacturers Bypass the Middleman with Direct-to-Consumer Online Business Models

Apparel & Textiles Industry Statistics

  1. Apparel & Textiles Industry Statistics and Market Size Overview
  2. U.S. Apparel Manufacturing Producer Price Index (PPI): 2003-2016
  3. Percent Change in Annual U.S. Apparel Manufacturing Producer Prices: 2004- January 2016
  4. Top 50 Countries Exporting Textiles & Apparel to the U.S., All MFA Fibers: 2014-2015
  5. Top 50 Destinations of U.S. Textiles & Apparel Exports: 2014-2015
  6. Top 25 Countries Exporting Apparel & Non-Apparel Textiles to the U.S., All MFA Fibers: 2014-2015
  7. Top 15 Countries Exporting Fabric, Man-Made Fiber Products, Cotton Products & Wool Products to the U.S., All MFA Fibers: 2014-2015
  8. U.S. Retail Sales, Selected Kinds of Businesses: 2009-2015
  9. U.S. Retail Sales of Apparel, Shoes & Accessories: 2015
  10. Worldwide Cotton Area, Yield & Production: 2013-2016
  11. Apparel & Textiles Industry Employment by Business Type, U.S.: 2011-2016

Companies Mentioned Include:

  • 3M COMPANY
  • Cabela’s Inc
  • Abercrombie & Fitch Co
  • Motorsports Authentics LLC
  • Alpha Pro Tech Ltd
  • American Eagle Outfitters Inc
  • Ann Inc
  • Aramark
  • Warnaco Swimwear Inc
  • Belk Inc

HOUSTON, Texas – Plunkett Research, Ltd. recently announced an important market research and competitive analysis report, Plunkett’s Advertising & Branding Industry Almanac, 2016 edition. A complete market research report, including forecasts and market estimates, technologies analysis and developments at innovative firms.

The size of the advertising market is difficult to assess.  This is partly due to the fact that the final cost of advertising for any company includes creative and agency costs; local branding and marketing efforts; catalogs, brochures and other printed matter; the creation and maintenance of web sites, email campaigns and social media campaigns; and myriad other components, in addition to expenses for media.  Recently, spending for ads on social media sites and the use of data mining and predictive analytics to study patterns of consumer media use has taken on significant importance within the advertising & branding industry. 

Key Findings:

  • Plunkett Research lists top 400 companies in Advertising & Branding and names top trends changing the industry for the mid term.

Available Formats:

  • Printed Almanac: ISBN 978-1-62831-392-5 (Availability Now)
  • E-book: ISBN 978-1-62831-725-1 (Availability Now)
  • Online Subscription

Key Features Include:

  • Industry trends analysis, market data and competitive intelligence
  • Market forecasts and Industry Statistics
  • Industry Associations and Professional Societies List
  • In-Depth Profiles of hundreds of leading companies
  • Industry Glossary
  • Buyer may register for free access to search and export data at Plunkett Research Online
  • Link to our 5-minute video overview of this industry

Pages: 500             

Statistical Tables Provided: 10

Companies Profiled: 359

Geographic Focus: Global

Price: $349.99

Key Questions Answered Include:

  • How is the industry evolving? 
  • How is the industry being shaped by new technologies? 
  • How is demand growing in emerging markets and mature economies?
  • What is the size of the market now and in the future?
  • What are the financial results of the leading companies?
  • What are the names and titles of top executives?

This feature-rich book covers competitive intelligence, market research and business analysis—everything you need to know about the advertising & branding business including:

  1. Introduction to the Advertising and Branding Industry 
  2. Online Advertising Becomes More Targeted, Takes 32.6 Percent Share of U.S. Advertising Market
  3. Programmatic Ad Buying Dominates the Market
  4. Television Ads Evolve to Face New Challenges, Formats and Online Competitors
  5. Embedded Advertising/Product Placement/Branded Entertainment and Marketing Soar
  6. Social Media to Generate $23.6 Billion in Global Online and Mobile Ad Revenues
  7. Email Reigns as One of the Single Most Effective Advertising Tools
  8. Newspapers and Magazines See Excellent Growth in Digital Editions and Apps 
  9. Location-Based Technology Delivers Targeted Ads and Discounts/Mobile Advertising
  10. LOHAS-Socially Conscious Consumers Create Challenges and Opportunities
  11. Hispanic Market Attracts Growing Advertising and Marketing Focus 
  12. Growth in Big Data Supported by Expansion of Cloud Computing and Predictive Analytics

Advertising & Branding Industry Statistics

  1. Advertising & Branding Industry Statistics and Market Size Overview
  2. Estimated U.S. Advertising Sector Revenues by NAICS Code: 2008-2015
  3. Advertising Agencies, Public Relations Agencies & Direct Mail Advertising: Estimated Sources of Revenue & Expenses, U.S.: 2008-2014
  4. Employment in Advertising & Related Industries, U.S.: 1990-2015
  5. Internet Publishing & Broadcasting & Web Search Portals: Estimated Revenue & Expenses, U.S.: 2010-2015
  6. Newspaper Publishers: Estimated Sources of Revenue & Expenses, U.S.: 2010-2015
  7. Periodical Publishers: Estimated Sources of Revenue & Expenses, U.S.: 2010-2015
  8. Radio Networks & Radio Stations: Estimated Sources of Revenue & Expenses, U.S.: 2010-2015
  9. Television Broadcasting: Estimated Sources of Revenue & Expenses, U.S.: 2010-2015
  10. Cable & Other Subscription Programming: Estimated Sources of Revenue & Expenses, U.S.:2010-2015

Companies Mentioned Include:

  • Xaxis
  • Belo Corp
  • Disney Media Networks
  • CBS Radio
  • ACME Communications Inc
  • Acxiom Corp
  • Advance Publications Inc
  • Alliance Data Systems Corporation
  • Alloy Inc
  • Time Warner Inc
Published: March 15, 2017.

Dollars & Details:

Ecommerce now accounts for $2 trillion in annual sales via the internet. Smartphones are now really SMART and basic models are reasonably affordable, providing always-on, always-with-you access to the many wonders of the electronic web. More than 50% of the world’s households have access to the Internet, and 50% of the world’s inhabitants have access to smartphones. It might be easy for you to think that the internet and its uses have hit a plateau and that it will be hard to achieve major advancements from here.

Not so fast! In the late 1990s, our CEO Jack Plunkett was making a speech to a group of analysts and researchers in Austin, Texas about the future of the internet, which he described as ready to rocket ahead. A member of the audience was unconvinced and asked, “Why would the soaring growth in the number of internet users and the time they spend online continue?’ Plunkett responded on-the-spot by writing this rule on the whiteboard:.

“Online activity grows exponentially as broadband access prices decline, access speed increases and wireless devices are adopted. This leads to increased offerings of enhanced online services and entertainment at more reasonable prices.”

Put another way: We’re still at the beginning of the internet revolution, and big things are about to happen!

Trends and Theories:

Consider a few current trends and the effect they will have on internet usage:

  • Apple : the iPhone is only now reaching its 10-year anniversary, and the 1 billionth iphone was sold a few months ago in July 2016.

  • 5G Wireless : In the early 2020’s, you’ll be able to download full-length movies to your wireless device nearly instantly, thanks to the upcoming global 5G speeds.

  • Satellite : Hughes Network Systems is about to launch the Gen5 satellite access system with blazing 25-meg download speeds and 3-meg upload. This means that millions of people living in remote areas, with no cable and very slow telephone, will be able to get world class internet access, for only $50 per month!

  • Netflix : 23% of all adults in US homes stream Netflix movies online daily. Not long ago, the only way you could get a movie from Netflix was via a DVD in the mail!

  • Learning Online : Online education provider Coursera now offers 1,837 different college-level and business training courses online to a user base of 22 million worldwide. IT’s adding 60,000 students per month in India alone. Not long ago, this level of education didn’t even exist online.


Ranks and Results:

Milestones-for-online-activity-ecommerce


Hot-off-the-Press:

All the information you need about the global wireless industry can be found at Plunkett Research, including our Computers Industry research center online , and our just-published, completely-updated Plunkett’s InfoTech Industry Almanac , 2017 edition.


Plunkett-Food-Industry-Almanac-2017

Published: March 8, 2017.
 

Dollars & Details:

While agriculture and food production account for a massive $8 trillion yearly, or 10% of global economic activity (GDP), farming is not an easy way to make money. Market prices for crops vary constantly. Droughts can be devastating. Meanwhile, costs of seeds, fertilizer, irrigation and equipment can create a huge financial burden. It’s time for technology to the rescue!

In the U.S. farmers brought in $353 billion in revenues during 2016, but crop prices have been depressed in recent years thanks to global competition and tough market conditions. (Farm revenues are projected to be $20 billion lower in 2025 than they were in 2014.) Farmers up to the challenge are taking advantage of the growing ways that agricultural technology (AgTech) can help reduce expenses and boost efficiencies. Prices for such technologies are dropping, while capabilities are improving. The hard part is that farmers need to develop the tech skills to take advantage of them.

Trends and Theories:

GPS and Precision Agriculture: Precision agriculture, also called precision farming, is in use to a growing extent across the globe. The intent is to increase yield, decrease costs (including manpower and water usage) and avoid problems in the field. Today, it primarily involves the use of GPS to guide tractors for precise tilling and planting. Eventually, it will evolve to include the use of remote wireless sensors, GPS, satellite imagery, predictive databases and other advanced technologies to monitor and react to soil, weather and crop conditions, such as the local level of soil moisture and soil nutrients. Robotics and nanotechnology will eventually be part of this trend.

Ag Drones: GPS maker Trimble also offers drones for aerial mapping and crop management. Drones have tremendous potential for precise monitoring of crop and soil conditions.

Irrigation Technologies: Agriculture is by far the world’s biggest user of water, and water scarcity is without doubt one of the greatest problems the world will face in coming years. Out of sheer necessity, vast amounts of money are being invested in research, development and implementation of advanced crop irrigation technologies. Leading nations in this field include Israel and China, both facing significant water scarcity issues.

Ranks and Results:


Statististics-for-US-Farms


Note: Agriculture creates significant export activity, with about $130 billion in annual farm exports from the U.S. alone.


Hot-off-the-Press:

All the information you need about the global wireless industry can be found at Plunkett Research, including our food industry research center online, and our just-published, completely-updated Plunkett’s Food Industry Almanac , 2017 edition.

Plunkett-Food-Industry-Almanac-2017

Published: February 28, 2017.
 

Dollars & Details:

The average annual income for an American household (2.5 people in average size) is roughly $71,000.  This has grown by about $8,000 since 2010, not adjusted for inflation. 

What do Americans do with that income?  Some $11,000 of it goes to income taxes.  Next, while we probably don’t save enough of our money, we do save more, on average, than you might think.  Of “disposable” income (what’s left after paying income taxes), we were saving about 5.4% in late 2016.  That’s a good increase from very low savings rates seen in 2005-2007, but a vast decrease from the 10%+ rates seen in the 1980s. 

Trends and Theories:

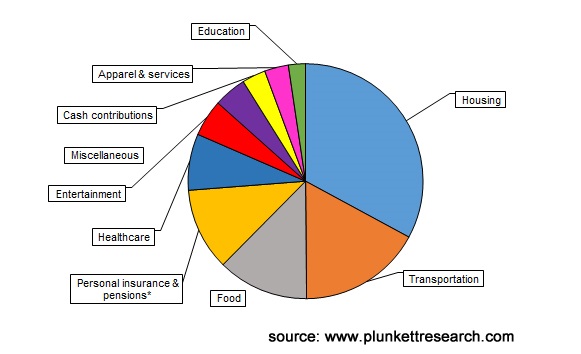
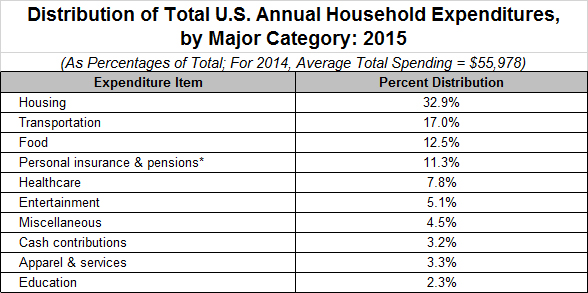
If health care and education hadn’t become so expensive in recent years, we might be putting a lot more money into savings and investment.  Health care now accounts for almost 8% of a typical household’s spending, a ratio that nearly doubled from 2005 through 2016! 

Education accounts for 2.3%, so much so that student loan totals (with $1.2 trillion outstanding balances) are 70% higher than total credit card balances.

Meanwhile, unhealthy habits take a big bite out of our wallets, with tobacco/smoking accounting for 0.6% of spending and alcoholic beverages nearly 1%.  Put another way, we spend five times as much on alcohol as we do on reading materials like books. 

Americans purchase 1 billion pair of shoes each year, but we nonetheless spend more on entertainment (5.1%) than we do on clothing (3.3%), and we spend more on transportation (17.0%) than we do on food (12.5%). 

We spend a roughly equal amount on food purchased to eat at home and food/beverages in restaurants.

Ranks and Results: 

While we still spend most of our money by walking into stores at America’s 116,000 shopping centers, it’s not a big surprise that we spend an ever-increasing portion of our money by shopping online. It isn’t at all hard to imagine Amazon becoming America’s largest retailer someday.  (A distinction currently held by Wal-Mart.)  Meanwhile, 15.8 Americans work in retail, making it one of our largest employment sectors by far.


Surprising-Ways-we-spend-our-money-1

Surprising-Ways-we-spend-our-money-2


Hot-off-the-Press:

All the information you need about the global wireless industry can be found at Plunkett Research, including our Retail Industry Research Center Online, and our just-published, completely-updated Plunkett’s Retail Industry Almanac, 2017 edition.

Plunkett-Retail Industry-Almanac-2017

Published: February 22, 2017.
 

Dollars & Details:

Now that we can entertain ourselves endlessly via our smartphones, you might assume that we’re spending less money on other types of (non-digital) entertainment.  Or you might assume that leisure and entertainment activities that aren’t digital now face so much competition from smartphone-based pastimes that prices for traditional leisure activities are dropping.  Very wrong on both counts.

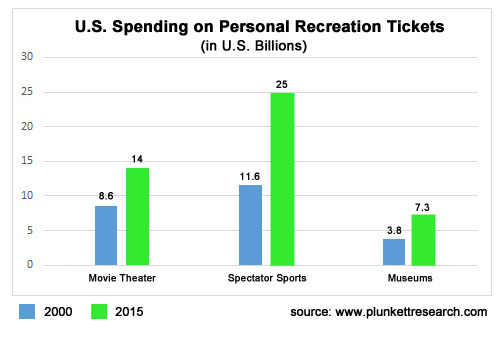
We’ve gone from static and flat (books and media printed on paper, music on CDs and movies rented on DVD at the local Blockbuster) to entertainment based on digital downloads, user-controlled, portable and always-with-you.  Nonetheless, despite this pervasive, portable digital entertainment, we’re spending a rapidly growing fortune on old habits in our quest for leisure time fulfillment and relaxation.  Officially, in the U.S., total spending on “recreation,” in a very broad sense, soared by 72% from 2000 through 2015, reaching a record total of $1.08 trillion!

Trends and Theories:

Prices for internet access, on a total gigabytes available per month basis, have plummeted, at the same time that we download more and more music, video, ebooks, podcasts and other entertaining media.  Nonetheless, expenditures on movie theater admission, sports events and other ways we relax have soared. 

Ranks and Results


Responsive image


Smartphones and the internet now rule the world, in terms of delivering instant entertainment gratification, but old habits are not dying off.

Hot-off-the-Press:  

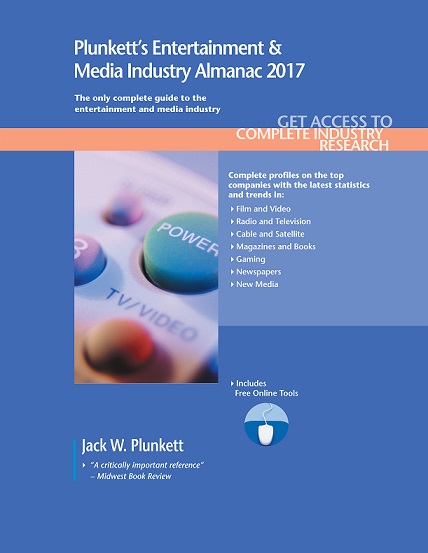
All the information you need about the global Entertainment industry can be found at Plunkett Research, including our Entertainment & Media Industry Research Center Online, and our recently published, completely-updated Plunkett’s Entertainment & Media Industry Almanac, 2017 edition.


Published: February 16, 2017.
 

Dollars & Details:

Intel made a major announcement about its intention to invest $7 billion in a new semiconductor plant, known as Fab 42, at Chandler, Arizona.  The 3,000 jobs it intends to create is a big deal.  The economic impact for Arizona is a big deal.   (Intel is already among Arizona’s top 10 corporate employers.  These new jobs will have very good pay and benefits.)

But, the impact on everyone in the world who uses computing devices is a much, much bigger deal!

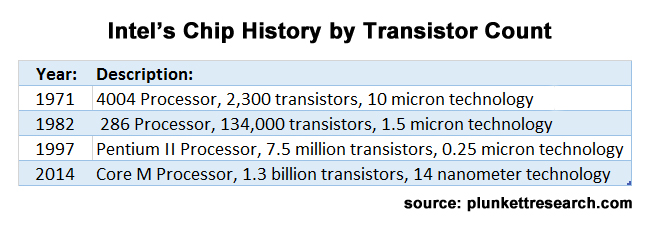
The next big thing in computers is always about “better, smaller, faster.”  Once completed around 2021, Fab 42 will be manufacturing among the most sophisticated and advanced chips in the world. 

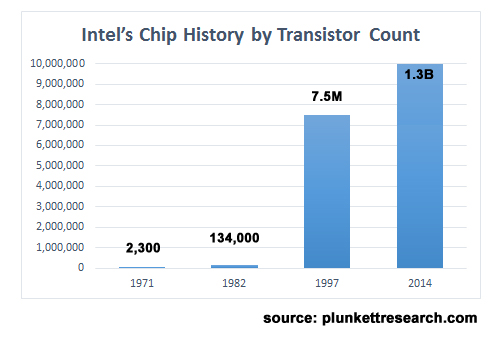
Chip density is the key here.  The 7-nanometer measurement refers to the smallest average feature on a chip.  The smaller the measurement, the more transistors that can be incorporated into a chip of given size.  A nanometer is one billionth of a meter.  A 7-nano chip may be able to hold as many as 20 billion transistors in one small, energy-efficient package!  That’s ten-times the transistors held on many of today’s more popular chips.

Trends and Theories:

Intel’s chips to be made in Arizona will move way beyond the 14-nanometer chips commonly produced today, and even beyond the latest 10-nanometer chips now entering production in many spots.  These 7-nanometer chips will be so fast and so advanced that they can provide incredible power and efficiencies to the world’s most important data centers, sensors and computers, and will be critical in advancing such areas as artificial intelligence and medical research.  In other words, this technology has the potential to make life better for everyone on Earth.

Ranks and Results: 


A chip, also known as a processor, is the heart of computing devices, including smartphones and the electronics that run modern factories, research facilities and even automobiles and aircraft.  Simply put, chips process information. The faster, the better.

Hot-off-the-Press:  

All the information you need about the global wireless industry can be found at Plunkett Research, including our Computer & Software Industry Research Center online, and our just-published, completely-updated Plunkett’s InfoTech Industry Almanac, 2017 edition.


Published: February 2, 2017.
 

Dollars & Details:

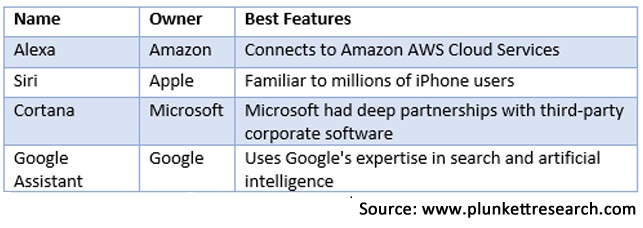
Apple, Google, Amazon and Microsoft are competing to offer the best voice-activated systems that can do anything from reporting the time and weather, to playing music on request, to performing web searches, to telling jokes, to making purchases from internet sites. 

There’s much more here than meets the eye (or ear).  These platforms utilize the latest in artificial intelligence in order to become more useful over time.  Apple’s Siri is available on iPhones, iPads, Apple Watches and through an app in some vehicles.  Google Now is an app available on a variety of mobile devices as is Microsoft’s Cortana app.  Amazon’s Alexa web app is installed on a gadget called Amazon Echo that sits on a countertop.  Google offers a similar device called Google Home.  All of these apps and platforms are voice-activated, and use connections to other apps and systems to find information such as directions, time, date, weather and trivia, or make purchases, which are reported audibly (users can choose their device’s voice gender and language). 

The next step is for these handy assistants to completely control your home, and much of your life, with apps relating to climate control, lighting, appliances, security and much more.  This will enable users to simply say, for example, “Set home temperature to 72 degrees,” or “Activate alarm system,” and have the action performed, even from remote locations.

Trends and Theories:

Importantly, these systems are open to third-party developers.  For example, Amazon has opened “Lex” to developers, which is the artificial intelligence engine behind the Alexa and Echo platforms.  Lex is tied into Amazon’s AWS cloud computing system.  Software and product developers can incorporate Lex, enabling voice-activated or click-activated responsiveness (often in the form of specific task-oriented icons or apps known as “bots”).  This gives these developers instant access to extremely powerful cloud computing, artificial intelligence and voice-activation in one easy-to-launch package.  Amazon charges a modest fee per thousand uses or data accesses.  Microsoft’s Cortana is being incorporated into applications by companies like Harman Kardon.  Apple’s Siri is part of its CarPlay platform, being picked up by major car makers.  This ease-of-use has spurred a tidal wave of new product development worldwide, with the potential to revolutionize the manner in which consumers interface with virtually everything.

Ranks and Results: 


Hot-off-the-Press:  

All the information you need about the global InfoTech industry can be found at Plunkett Research, including our computers and software research center online, and our just-published, completely-updated Plunkett’s Infotech Industry Almanac, 2017 edition.  

What You get

Complete data and market research for the industry(s) of your choice, including:

  • Market Research
  • Technologies Analysis
  • Business Intelligence and “hard-to-find” facts
  • Key Industry Associations (with contact information)
  • Corporate Executive Contracts
  • Industry Glossary
  • Data Export Tools
  • Top Companies Data