
News


With some planning ahead, market research projects can be designed in a way that will serve multiple purposes at once. This not only lets you be more cost-effective, it also will help you to make smarter strategic decisions. Here are 4 tips that will help you make the most of your own research projects.


1) Consumer studies—Design your market research project for multiple purposes, including:

•  Determine the strength of your brand

•  Understand consumers' product needs, likes and frustrations

•  Understand evolving consumer attitudes and desires

•  Understand how consumers search for products/services in your category

•  Understand what drives consumers’ final buying decisions

•  Identify areas where consumers are frustrated by choice, price or service


2) B2B and Industry studies—Design your project in a way that will develop strategic insights, such as:

•  Verify the size of your market and its growth patterns

•  Verify the need for a new product or service

•  Identify points of pain and frustration among potential customers

•  Understand your competitors

–  Who are they?

–  What are their strengths?

–  What are their weaknesses?

–  In which areas are they investing or innovating?


3) Build a competitive intelligence database—build a custom database that will enable you to better monitor competitors, disruptions and potential acquisition candidates, such as:

•  Competitor’s locations

•  Competitor’s products and prices

•  Competitor’s patents or R&D activities

•  Competitor’s structure and revenues

•  Identify potentially disruptive startups and new technologies

•  Identify foreign firms with the potential to take market share from you

•  Identify and rank/score acquisition candidates


3) Build a competitive intelligence database—build a custom database that will enable you to better monitor competitors, disruptions and potential acquisition candidates, such as:

•  Identify potential customers

•  Identify potential distributors or partners

•  Research and identify potential suppliers


Download our new Brochure: 4 Ways That Market Research Can Help You Make Smart Decisions

Visit our Custom Market Research Page

Image


Now, more than ever before, our user tools and innovative data make Plunkett Research your go-to place for industry analysis, business trends and statistics.  For any further question contact us at  customersupport@plunkettresearch.com | voice: 713.932.0000 | fax: 713.932.7080

The sharing economy is disrupting the nature of work, employment and entrepreneurship. Plunkett Research has found that many sharing/gig workers consider themselves to be “entrepreneurs.” While they may not have created a new company that employs others or makes products, they nonetheless are working for themselves, independently, using their own tools or vehicles and setting their own schedules. In that regard, they are literally running a business, in the same way that a one-man plumbing shop is a business. Traditional new business formation has been weak in the U.S., which is a startling change. For example, despite the fact that the American economy had rebounded reasonably well from the 2007-09 recession by 2014, the Census Bureau showed that new business formation had reached a 40-year low in that year.

We believe that the decline in small business startups is fueled by the ease of finding independent work in the sharing economy, with little or no capital or risk involved. In addition, working independently in this manner generally requires no specialized education, and no licensing beyond a drivers’ license. This type of work also lends itself very well to people, such as retirees or students, who only want to work part-time, or who want a part-time sideline in addition to a regular job. One study found that 49% of part-time independent workers also had a full-time traditional job. People who intentionally chose the independent work life often report high levels of satisfaction with their work life compared to traditional workers.

There is a significant debate underway in many nations as to whether or not people working as Uber drivers, Instacart shoppers and similar agents are actually employees, rather than contract workers. Legislative reform may well be attempted on large scale in this regard. In some cases, class action lawsuits have been filed by the contract workers. If governments rule that such workers are employees, it would have a massive effect on the business models of sharing economy firms. In the U.S., for example, it would mean that firms are subject to paying payroll taxes such as Social Security, and are subject to very high levels of labor, safety, health and anti-discrimination laws. This debate will likely continue for many years to come, and may well lead to legal reform in some nations. Another outcome may be the formation of contractor workers’ unions or union-like organizations that might demand better pay or working conditions. The “Independent Drivers Guild” now exists in New York City, representing tens of thousands of local Uber drivers, but not quite acting as a true labor union.

Sharing & Gig Economy, Freelance Workers & On-Demand Delivery Industry

Image

At Plunkett Research Online, and


Almanac Editions: Publication: January, 2018 | Price: $379.99


Printed ISBN: 978-1-62831-478-6 | eBook ISBN: 978-1-62831-803-6


Now, more than ever before, our user tools and innovative data make Plunkett Research your go-to place for industry analysis, business trends and statistics.  For any further question contact us at  customersupport@plunkettresearch.com | voice: 713.932.0000 | fax: 713.932.7080

HOUSTON, Texas – Plunkett Research, Ltd. recently announced an important market research and competitive analysis report on trends affecting job seekers, Mid-Size U.S. Employers Almanac, 2018 edition.

Job seekers in 2018 should see reasonably strong hiring and rising wages, if the low unemployment rates seen in early 2018 continue, and if confidence remains reasonably high for both consumers and business leaders.  Nonetheless, total growth of the U.S. economy has been disappointing for several years, and this relatively slow growth has a negative effect on hiring and wages. America’s job market is looking better than it has in recent years, and job seekers, including new college grads, should see a reasonable level of job openings.  There will be good opportunities for those who are diligent in seeking top employers in most business sectors.

Key Findings:

  • Plunkett Research lists top 500 companies for Mid-Size Employers and names top trends affecting job seekers for the mid term.

Available Formats:

  • Printed Almanac: ISBN 978-1-62831-473-1 (Available Now)
  • E-book: ISBN 978-1-62831-774-9 (Available Now)
  • Online Subscription


Key Features Include:

  • Industry trends analysis, market data and competitive intelligence
  • Market forecasts and Industry Statistics
  • Industry Associations and Professional Societies List
  • In-Depth Profiles of hundreds of leading companies
  • Industry Glossary
  • Buyer may register for free access to search and export data at Plunkett Research Online
  • Link to our 5-minute video overview of this industry

Pages: 614             

Statistical Tables Provided: 11

Companies Profiled: 499

Geographic Focus: US

Price: $379.99

This feature-rich book covers major trends affecting job seekers—everything you need to know about major U.S. employers including:

  1. U.S. Job Market Overview
  2. Cost Control Remains a Major Concern at Employers/Consolidation Through Mergers Continues
  3. Unemployment Is Down Substantially Compared to the Recent Past
  4. The Sharing & Gig Economy’s Effect on Employment, Work Life and Careers
  5. Technology Continues to Create Sweeping Changes in the Workplace
  6. Continued Growth in Outsourcing, Including Supply Chain and Logistics Services
  7. Millions Working as Temps
  8. Offshoring, Reshoring and the Rebound in American Manufacturing
  9. Older Americans Will Delay Retirement and Work Longer/Many Employers Find Older Employees Desirable
  10. Employment Sectors that Will Offer an Above-Average Number of Job Opportunities

Employment Statistics

  1. U.S. Employment Overview: 2016-2017
  2. U.S. Civilian Labor Force: 1997-June 2017
  3. Employment by Major Industry Sector: 2004, 2014 & Projected 2024
  4. Number of People Employed and Unemployed, U.S.: June 2016 vs. June 2017
  5. U.S. Labor Force Ages 16 to 24 Years Old by School Enrollment, Educational Attainment, Sex, Race & Ethnicity: October 2016
  6. Medical Care Benefits in the U.S.: Access, Participation and Take-Up Rates, March 2017
  7. Retirement Benefits in the U.S.: Access, Participation and Take-Up Rates, March 2017
  8. Top 30 U.S. Occupations by Numerical Change in Job Growth: 2014-2024
  9. Top 30 U.S. Occupations by Percent Change in Job Growth: 2014-2024
  10. Occupations with the Largest Expected Employment Increases, U.S.: 2014-2024
  11. Occupations with the Fastest Expected Decline, U.S.: 2014-2024

Research: 7 Keys for Job Seekers

  1. Financial Stability
  2. Growth Plans
  3. Research & Development Programs
  4. Product Launch & Production
  5. Marketing & Distribution Methods
  6. Employee Benefits
  7. Quality of Work Factors


Research is Now Completed on these Three Vital New Industry Sectors: Aerospace & Drones; Sharing & Gig Economy; and Consumer Goods & Services

Great news, we've completed publishing our in-depth coverage of these three vital industry sectors for our 2018 online database and almanacs list. Subscribers to Plunkett Research Online now have complete access to tens of thousands of pieces of data on these exciting sectors. Below, you’ll find data highlights, plus title information on our new almanacs in printed an ebook formats.

Sharing & Gig Economy, Freelance Workers & On-Demand Delivery Industry

Image

At Plunkett Research Online, and

Almanac Editions: Publication: January, 2018 | Price: $379.99

Printed ISBN: 978-1-62831-478-6 | eBook ISBN: 978-1-62831-803-6

    Sharing & Gig Economy: The sharing and gig economy is a truly disruptive development that was enabled through the rapid deployment of the smartphone and the ease of development of building web-based services via databases hosted in the cloud. The nature of this industry is disruptive because the sharing economy offers very advanced solutions to everyday problems, saving time and effort for consumers, and often saving costs and creating efficiencies in the process, whether it’s the ease of getting a restaurant meal ordered and delivered to the home or the convenience of booking a pet groomer that will come to your home to wash your dogs.

    The traditional taxi business has been literally overwhelmed by competition from ride-hailing services such as Didi, Uber and Lyft. Taxi service, particularly in the United States, can be incredibly frustrating—there is nothing worse than waiting in the rain for an empty taxi to cruise by. In contrast, platforms like Uber have given consumers the power to hail a ride from their smartphones, watch on a digital map as the vehicle nears the pickup destination, and pay seamlessly via a saved credit card or other payment option such as PayPal once the ride is completed. This is such an advancement that the world’s largest automobile manufacturers are now planning for the day when a massive segment of global consumers will opt to use ride-hailing as their everyday transportation, declining to purchase and own personal automobiles. (more)

Aerospace, Aircraft, Satellites & Drones Industry

Image

At Plunkett Research Online, and

Almanac Editions: Publication: 02/05/2018 | Price: $379.99

Printed ISBN: 978-1-62831-476-2 | eBook ISBN: 978-1-62831-801-2

    The aerospace industry plays a vital role in such sectors as global trade and commerce, communications, transportation, and defense. More than just airlines and aircraft manufacturing, the aerospace industry includes original equipment manufacturing (OEM), avionics, electronics, rockets, space vehicles, satellites, and drones. The complex needs for achieving flight also makes the aerospace industry a key contributor to advancements in computing, advanced materials, and manufacturing.

    At Plunkett Research, we estimate the global aerospace market at $1 trillion for 2017. The Satellite Industry Association (SIA) places the global satellite sector at $261 billion for 2016, including $13.9 billion for satellite manufacturing and $5.5 billion for the launch industry. About one-half, or $127.7 billion, of satellite revenues are for services, such as the satellite support of TV. (more)

Consumer Products, Cosmetics, Hair & Personal Services Industry

Image

At Plunkett Research Online, and

Almanac Editions: Publication: 02/15/2018 | Price: $379.99

Printed ISBN: 978-1-62831-477-9 | eBook ISBN: 978-1-62831-802-9

     In Consumer Goods & Services, digital marketing has been incredibly disruptive, enabling startups to gain rapid popularity and grab market share from incumbents.  For example, small cosmetics or pet products firms can readily set up shop with their own websites.  They can also reach millions of potential consumers via global sites such as the Amazon Marketplace and China’s Tmall.

    While the barriers to launching a startup are low, the competition is fierce. It can be virtually impossible to get shelf space in drug stores or supermarkets for a new product. This makes the flexibility of the internet absolutely vital to a startup. Gross profit margins tend to be very high in many consumer products. That is, the cost to manufacture a beauty product typically represents a tiny fraction of the retail price. These high gross profit margins attract a large number of savvy entrepreneurs who see the opportunity to disrupt various product categories. (more)


Now, more than ever before, our user tools and innovative data make Plunkett Research your go-to place for industry analysis, business trends and statistics.  For any further question contact us at  customersupport@plunkettresearch.com | voice: 713.932.0000 | fax: 713.932.7080

Complete Guide to the Food Industry From Plunkett Research 2018

HOUSTON, Texas – Plunkett Research, Ltd. recently announced an important market research and competitive analysis report, Food Industry Almanac, 2018 edition. A complete market research report, including forecasts and market estimates, technologies analysis and developments at innovative firms.

The global food and agricultural industry for 2017 totaled about $8.1 trillion, according to Plunkett Research estimates, or about 10% of the world’s GDP.  Global food exports totaled $1.35 trillion in 2016, according to the World Trade Organization (latest data available).  While it is obvious that food is of equal importance to all people on planet Earth, the relative cost of that food is not equal.  It varies widely due to such influences as location, local food industries and the availability of proper infrastructure for food transportation and storage.

Key Findings:

  • Plunkett Research lists top 500 companies in the Food Industry and names the top trends changing for the mid term.

Available Formats:

  • Printed Almanac: ISBN 978-1-62831-470-0 (Available Now)
  • E-book: ISBN 978-1-62831-772-5 (Available Now)
  • Online Subscription


Key Features Include:

  • Industry trends analysis, market data and competitive intelligence
  • Market forecasts and Industry Statistics
  • Industry Associations and Professional Societies List
  • In-Depth Profiles of hundreds of leading companies
  • Industry Glossary
  • Link to our 5-minute video overview of this industry

Pages: 710

Statistical Tables Provided: 31

Companies Profiled: 502

Geographic Focus: Global

Price: $379.99

Key Questions Answered Include:

  • How is the industry evolving? 
  • How is the industry being shaped by new technologies? 
  • How is demand growing in emerging markets and mature economies?
  • What is the size of the market now and in the future?
  • What are the financial results of the leading companies?
  • What are the names and titles of top executives?
  • What are the top companies and what are their revenues?

This feature-rich book covers competitive intelligence, market research and business analysis—everything you need to know about the food business including:

  1. The Globalization of the Food Industry/Brazilian Firms Acquire Major U.S.-Based Food Producers
  2. Genetically Modified (GM) Seeds and Crops Planted in Dozens of Nations/Agribio R&D Investment Is High
  3. Cloning of Farm Animals/Meat and Cheese Substitutes Created in Laboratories/3-D Printed Food Appears
  4. Selective Breeding, Zinc Fingers, Mutagenesis and Gene-Editing as Alternatives to GMOs
  5. Obesity Sparks Government, School and Corporate Initiatives/Snack Foods Get Healthier/Taxes on Unhealthy Foods
  6. Organic Food Sales Continue Global Growth/Locally Sourced Foods and Farm to Table Increase in Popularity
  7. Manhattan’s FreshDirect Sets the Pace in Grocery Sales Over the Internet/Amazon Competes in Groceries
  8. Precision Agriculture Technologies (AgTech), Farm Robotics, GPS and Irrigation Market Grows Worldwide/Hi Tech Greenhouses
  9. Aquaculture Gains Major Fish Supply Market Share
  10. Packaging Technology Improves/Wal-Mart and Coca-Cola Boost Packaging Sustainability
  11. Retail Technologies Advance for Store Checkout and Restaurant Orders/Apps and Location-Based Ads Drive Sales
  12. Private Label Brands Grow in Share of Total Store Sales
  13. Soft Drinks’ Market Share Declines while Bottled Water Sales Soar
  14. Consumers Drive a Revolution in the Food Industry, Demanding Fresher, More Natural Foods, Creating both Pain and Opportunities for Companies
  15. Food Waste on the Rise/Recycling Efforts Underway
  16. Wages for Restaurant, Hotel and Hospitality Workers Cause Controversy
  17. Meal Kits From Firms like Blue Apron Make It Easy to Prepare Home-Cooked Meals Without Shopping at Supermarkets

Food Industry Statistics

  1. Global Food Industry Statistics and Market Size Overview
  2. U.S. Food Industry Statistics and Market Size Overview       
  3. Food Sales, U.S.: 2013-2017  
  4. Changes in Food Price Indexes, U.S.: 2016-2018       
  5. Gross Output in the Food & Beverage & Tobacco Product Manufacturing Industries, U.S.: Selected Years, 2010-2016       
  6. Retail Prices for Beef, Pork, Poultry Cuts, Eggs & Dairy Products, U.S.: July 2017-January 2018     
  7. Meat Supply & Use, U.S.: 2016-2027 
  8. Egg Supply & Use, U.S.: 2016-2027   
  9. Poultry & Eggs Production, Use, Prices & Trade, U.S.: 2015-2018    
  10. Dairy Production & Prices, U.S.: 2015 – January 2018           
  11. Horticultural Crops, Baseline Projections, U.S.: 2016-2027  
  12. Fruit Production, Per Capita Consumption, Retail Prices & Grower Returns, U.S.: 2007-2016
  13. Planted & Harvested Acreage for Major Field Crops, Baseline Projections, U.S.: 2016-2028          
  14. Cost of Production Forecasts for U.S. Corn, Soybean, Wheat & Cotton Crops: 2017-2018 
  15. Cost of Production Forecasts for U.S. Rice, Peanuts, Sorghum, Oats & Barley Crops: 2017-2018   
  16. Global Area of Biotech Crops by Country: 2016
  17. Income Statement for U.S. Farm Sector: 2014-2018
  18. Farm Sector Cash Receipts from Sales of Agricultural Commodities, U.S.: 2013-2018
  19. Farm Sector Production Expenses, U.S.: 2013-2018
  20. Federal R&D & R&D Plant Funding for Agriculture, U.S.: Fiscal Years 2015-2017
  21. Direct Government Payments to U.S. Farms: 2012-2018
  22. Average Farm Operator Household Income & Assets, U.S.: 2013-2018
  23. Farm Receipts, Expenses & Income, Baseline Projections, U.S.: 2016-2027
  24. Value Added to the U.S. Economy by the Agricultural Sector via the Production of Goods and Services: 2013-2018
  25. Summary of U.S. Agricultural Trade Projections: Fiscal Years 2016-2027
  26. Total U.S. Agricultural Commodity Exports & Imports, Top Ten Countries: 2013-January 2018
  27. Value of U.S. Agricultural Exports & Imports by Commodity Group: 2013-January 2018
  28. Food Industry Employment, U.S.: 2012-January 2018
  29. Food Preparation and Serving Related Employment and Wage Estimates by Occupation, U.S.: May 2016
  30. World Supply & Utilization of Major Crops: 2015-2018
  31. World Supply & Utilization of Major Animal Products: 2012-October 2017

Companies Mentioned Include:

  • Molson Coors Brewing Company
  • Ben & Jerry's Homemade Inc
  • Kendall-Jackson Wine Estates Ltd
  • Marathon Cheese Corporation
  • Merisant Company
  • Ahold USA Inc
  • Agri-Mark Inc
  • Newly Weds Foods Inc
  • Ajinomoto Co Inc
  • Albertsons LLC

HOUSTON, Texas – Plunkett Research, Ltd. recently announced an important market research and competitive analysis report, Green Technology (GreenTech), Clean Technology (CleanTech), & Sustainability Industry Almanac, 2018 edition. A complete market research report, including forecasts and market estimates, technologies analysis and developments at innovative firms.

The phrase “green technology” generally refers to the application of advanced systems and services to a wide variety of industry sectors in order to improve sustainability and efficiency.  These improvements could include:  reduction of waste, spoilage and shrinkage; improvement of energy efficiency and energy conservation; creation of systems that are energy self-sustaining; the reduction of carbon emissions; a reduction in toxic waste and the emission of toxic gasses such as volatile organic compounds (VOCs); creation of products that are biodegradable; enhancement of water conservation and water quality; and promotion of the reuse and recycling of materials of all types. Plunkett Research estimates the green tech sector to represent about 5.3% of global GDP for 2017, or approximately $4.13 trillion.

Key Findings:

  • Plunkett Research lists top 300 companies in the Green Technology Industry and names the top trends changing for the mid term.

Available Formats:

  • Printed Almanac: ISBN 978-1-62831-472-4 (Available Now)
  • E-book: ISBN 978-1-62831-771-8 (Available Now)
  • Online Subscription

Key Features Include:

  • Industry trends analysis, market data and competitive intelligence
  • Market forecasts and Industry Statistics
  • Industry Associations and Professional Societies List
  • In-Depth Profiles of hundreds of leading companies
  • Industry Glossary
  • Link to our 5-minute video overview of this industry

Pages: 436              

Statistical Tables Provided: 26

Companies Profiled: 269

Geographic Focus: Global

Price: $379.99

Key Questions Answered Include:

  • How is the industry evolving? 
  • How is the industry being shaped by new technologies? 
  • How is demand growing in emerging markets and mature economies?
  • What is the size of the market now and in the future?
  • What are the financial results of the leading companies?
  • What are the names and titles of top executives?
  • What are the top companies and what are their revenues?

This feature-rich book covers competitive intelligence, market research and business analysis—everything you need to know about the green technology business including:

  1. Demand for Green Technologies and Conservation Practices Evolves, Fueling Investment and New Product Development
  2. Water Conservation Technologies to Enjoy Tremendous Growth/China Targets Desalination       
  3. Recycling Flourishes/Plasma Arc Gasification Technology Looks Promising
  4. Food Waste on the Rise/Recycling Efforts Underway
  5. Biomass, Waste-to-Energy, Waste Methane and Biofuels from Algae
  6. Smart Cities Utilize Big Data, Sensors and Advanced Technologies to Increase Efficiencies of All Kinds/Massive Business Opportunities Emerge
  7. Packaging Technology Improves/Wal-Mart and Coca-Cola Boost Packaging Sustainability
  8. Lower Energy Intensity Is a Prime Focus in China/U.S. Achieves Dramatic Energy Intensity Reductions
  9. Environmentalists Campaign for Chemical Industry Reform
  10. Homes and Commercial Buildings Seek Green Certification
  11. Major Research and Advancements in Lithium Batteries/Tesla and Panasonic Open the Gigafactory
  12. Fuel Cell and Hydrogen Power Research Continues/Fuel Cell Cars Enter Market
  13. Car Sharing Programs Like Zipcar and Autolib, AKA Mobility Services, Proliferate
  14. Electric Cars and Plug-in Hybrids (PHEVs) Enter Market in Low Numbers
  15. The Energy Industry Invests in Storage Battery Technologies with an Eye on Distributed Power and Renewables
  16. Superconductivity Provides Advanced Electricity Distribution Technology
  17. Bio-plastics Become a Reality/Plastic Packaging Made from Corn and Soy

Green Technology Industry Statistics

  1. GreenTech Industry Statistics and Market Size Overview
  2. Global Alternative Energy Industry Statistics and Market Size Overview
  3. Global Green Technology Industry Revenues: 2017
  4. Energy Production by Renewable Energy, U.S.: Selected Years, 1950-2016
  5. Net Electrical Power Generation From Renewable Energy Sources, U.S.: 2000-July 2017
  6. Total Renewable Electricity Net Generation by Source & State, U.S.: 2016
  7. Share of Electricity Generation by Energy Source, U.S.: Projections, 2016-2050
  8. Estimated Levelized Cost of Electricity (LCOE) for New Electricity Generation by Energy Source
  9. U.S. Renewable Energy Consumption by Energy Source, 2010 vs. 2016
  10. Renewable Energy Consumption by Source, U.S.: Selected Years, 1950-2016
  11. Renewable Energy Consumption in the Residential, Commercial & Industrial Sectors, U.S.: 2010-2016
  12. Renewable Energy Consumption in the Transportation & Electric Power Sectors, U.S.: 2010-2016
  13. Fuel Ethanol Production & Consumption, U.S.: 1981-July 2017
  14. Biodiesel Production & Consumption, U.S.: 2001- July 2017
  15. Light Bulb Comparison
  16. Global Area of Biotech Crops by Country: 2016
  17. Federal R&D Funding by Character of Work and Facilities and Equipment, U.S.: Fiscal Years 2016-2018
  18. Federal Funding for R&D & R&D Plant, by Budget Function, U.S.: Fiscal Years 2011-2017
  19. U.S. Department of Energy Funding for Science & Energy Programs: 2016-2018
  20. Federal R&D & R&D Plant Funding for Energy, U.S.: Fiscal Years 2015-2017
  21. Federal R&D & R&D Plant Funding for General Science & Basic Research, U.S.: Fiscal Years 2015-2017
  22. Federal R&D & R&D Plant Funding for Transportation, U.S.: Fiscal Years 2015-2017
  23. Federal R&D & R&D Plant Funding for Natural Resources & Environment, U.S.: Fiscal Years 2015-2017
  24. Federal R&D & R&D Plant Funding for Agriculture, U.S.: Fiscal Years 2015-2017
  25. Federal Funding for Research, by Agency & Field of Science & Engineering, U.S.: Fiscal Year  2017
  26. Major Patenting U.S. Universities: 2015

Companies Mentioned Include:

  • 3M Company
  • ABB Ltd
  • AkzoNobel NV
  • Samsung Electronics Co Ltd
  • Alstom SA
  • American Superconductor Corp
  • Applied Materials Inc
  • Arotech Corporation
  • Ballard Power Systems Inc
  • BASF SE

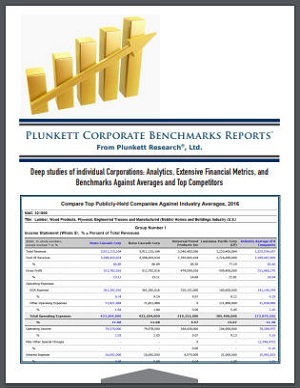
Our new Plunkett’s Corporate Benchmarks reports give you key performance indicators and deep financial benchmarks, available on each of our 3,800 major U.S. companies. We add unique value by providing comparisons of a company to its peers and to its industry’s averages. These reports will save you countless hours of research and help you to drill down into vital insights.

Core Benefits Include:

1. Comprehensive overview of a company’s financial results, ratios, vital statistics and metrics in one package.

2. Comparisons of deep financials and ratios for your target company to the leading competitors within its primary industry.

3. Historical financial data (multiple years) for the company and its peers.

4. Detailed, multi-year financial averages for all public companies within the industry.

5. U.S. Industry market size for your target company’s business sector, plus historical and forecast CAGR and market revenues.

6. Snapshot profiles of your target company’s top competitors.

7. Rankings of your target company against the top companies within the industry (9 key rankings).

Plunkett’s Corporate Benchmarks are perfect tools for consultants, investors, lenders, CFOs and specialists in mergers & acquisitions.

Image

You can download a sample report, and see report availability for specific companies at: https://www.plunkettresearch.com/corporate-financial-analysis-benchmarks-reports/

Each report is updated annually and runs about 65 pages. Reports are priced at $1,995 for one user, and $4,995 for enterprise-wide use. You can order online at Plunkett Research, or purchase the reports via your favorite market research reseller.


Now, more than ever before, our user tools and innovative data make Plunkett Research your go-to place for industry analysis, business trends and statistics.  For any further question contact us at  customersupport@plunkettresearch.com | voice: 713.932.0000 | fax: 713.932.7080
Plunkett Research has launched terrific new insights on consumer products and services of all types. This new data is now available at Plunkett Research Online, and in a brand-new book: Plunkett’s Consumer Products, Cosmetics, Hair & Personal Services Industry Almanac, 2018 edition.

Image      

Printed Almanac ISBN: 978-1-62831-477-9 | E-book ISBN: 978-1-62831-802-9

Consumer products and services are an ingrained part of everyday life and important industrial sector. At Plunkett Research, the consumer products industry includes household products, soaps and cleansers, cosmetics and makeup, skin care, nail care and hair care.

Also, we consider a wide range of businesses to be in the consumer services sector, including pet care; nail and hair salons; spas and massage services, and many other types of personal services. Plunkett Research estimates the U.S. market for barber, hair, beauty and nail salons, as well as diet centers, spas and similar personal services, at $70 billion for 2018, to grow to $89 billion by 2024. The global beauty products and personal care products market is estimated at $450 billion. We estimate U.S. Cosmetics, personal care and household cleansers manufacturing industry revenues at about $95 billion for 2018, growing to $124 billion by 2024.

While mass-market retailers, including discount stores, department stores, drugstores and supermarkets, are major sellers of consumer products, there are also a considerable number of specialty stores, including the Ulta chain of beauty and skin care products, as well as its competitor Sephora. Plunkett Research estimates the specialty cosmetic and beauty supply store industry in the U.S. at $15 billion for 2018, growing to $19 billion.


Now, more than ever before, our user tools and innovative data make Plunkett Research your go-to place for industry analysis, business trends and statistics.  For any further question contact us at  customersupport@plunkettresearch.com | voice: 713.932.0000 | fax: 713.932.7080

HOUSTON, Texas – Plunkett Research, Ltd. recently announced an important market research and competitive analysis report, Consumer Products, Cosmetics, Hair & Personal Services Industry Almanac, 2018 edition. A complete market research report, including forecasts and market estimates, technologies analysis and developments at innovative firms.

Consumer products and services are such an ingrained part of everyday life it might be easy to forget their importance as an industrial sector. Ranging from household products, to soap, to cosmetics and makeup, the consumer products industry provides a large portion of daily needs. At Plunkett Research, we estimate U.S Cosmetics, personal care and household cleansers manufacturing industry revenues at about $95 billion for 2018, growing to $124 billion by 2024.

Key Findings:

  • Plunkett Research lists top 200 companies in the Consumer Products, Cosmetics, Hair & Personal Services Industry and names the top trends changing for the mid term.

Available Formats:

  • Printed Almanac: ISBN 978-1-62831-477-9 (Available)
  • E-book: ISBN 978-1-62831-802-9 (Available)
  • Online Subscription


Key Features Include:

  • Industry trends analysis, market data and competitive intelligence
  • Market forecasts and Industry Statistics
  • Industry Associations and Professional Societies List
  • In-Depth Profiles of hundreds of leading companies
  • Industry Glossary
  • Link to our 5-minute video overview of this industry

Pages: 304             

Statistical Tables Provided: 14

Companies Profiled: 186

Geographic Focus: Global

Price: $379.99

Key Questions Answered Include:

  • How is the industry evolving? 
  • How is the industry being shaped by new technologies? 
  • How is demand growing in emerging markets and mature economies?
  • What is the size of the market now and in the future?
  • What are the financial results of the leading companies?
  • What are the names and titles of top executives?
  • What are the top companies and what are their revenues?

This feature-rich book covers competitive intelligence, market research and business analysis—everything you need to know about the Consumer Products, Cosmetics, Hair & Personal Services business including:

  1. Introduction to the Consumer Products Industry
  2. Online Marketing, Social Media and Ecommerce Enable Startups and Disruption in Consumer Products and Cosmetics
  3. A Growing Middle Class in Emerging Markets Creates Vast New Opportunities for Consumer Products
  4. Amazon Continues to Boost Its Market Share
  5. LOHAS-Socially Conscious Consumers Create Challenges and Opportunities for Advertisers and Marketers
  6. Luxury Apparel, Accessories and Consumer Products Lines Compete for Growth
  7. Private Label Brands Grow in Share of Total Store Sales
  8. Diverse Selling Techniques Boost Direct Marketers and Non-Store Sales
  9. Super Beauty Stores Combine Shopping with Personal Care Services
  10. Up and Coming Independent Beauty Firms Snapped Up by Major Players
  11. Social Media Spurs Beauty Sales Among Millennials and Teens
  12. Beauty Firms Target Unique Needs of Diverse Consumers Worldwide
  13. On-Demand Products and Services on the Rise in Pet Care, Laundry and At-Home Hair and Beauty Care
  14. Regis Dominates the Hair Salon Business/Product Sales Enhance Salon Profits
  15. Natural/Organic Consumer Products Attract Greater Market Share
  16. Marketing for Soaps and Cleaners Shifts to Individual Pods, Retail Price Discounts

Consumer Products, Cosmetics, Hair & Personal Services Industry Statistics

  1. Consumer Goods & Services Industry Statistics and Market Size Overview
  2. Annual Consumer Price Index, 1935-2017, U.S.        
  3. Average Annual Expenditures of All Consumer Households: 2011-2016, U.S.         
  4. Distribution of Total U.S. Annual Household Expenditures, by Major Category: 2015        
  5. Total U.S. Disposable Income, Expenditures & Gross Domestic & National Product Per Capita: Selected Years, 1960-2016    
  6. Consumer Goods & Services Retail Sales by Kind of Business, U.S.: 2011-2016       
  7. Consumer Goods & Services Retail Sales by Kind of Business, U.S.: Monthly, through July 2017
  8. U.S. Exports & Imports of Food: 2011-2nd Quarter 2017     
  9. U.S. Exports & Imports of Beverages & Tobacco Products: 2011-2nd Quarter 2017           
  10. U.S. Exports & Imports of Apparel Products: 2011-2nd Quarter 2017         
  11. U.S. Exports & Imports of Paper: 2011-2nd Quarter 2017
  12. U.S. Exports & Imports of Pharmaceuticals & Medicines: 2011-2nd Quarter 2017 
  13. U.S. Exports & Imports of Soaps, Cleaning Compounds & Toilet Preparations: 2011-2nd Quarter 2017           
  14. Consumer Goods & Services Industry Employment, U.S.: 2010- July 2017

Companies Mentioned Include:

  • Avon Products Inc.
  • Cos Bar USA Inc
  • Fetch! Pet Care Inc
  • Great Clips Inc
  • Jenny Craig Inc
  • NuGene International Inc
  • Seventh Generation Inc
  • Vitamin Shoppe Industries Inc

HOUSTON, Texas – Plunkett Research, Ltd. recently announced an important market research and competitive analysis report, E-Commerce & Internet Industry Almanac, 2018 edition. A complete market research report, including forecasts and market estimates, technologies analysis and developments at innovative firms.

The global internet audience continues to grow steadily, with the worldwide base of broadband internet users (including fixed and wireless) in excess of 4 billion range as 2018 began.  This vast base of high speed internet users encourages businesses to innovate in order to offer an ever-evolving array of online services.  Sectors that are growing very rapidly online include the sale of entertainment products, travel, apparel and consumer electronics.  Even groceries have moved into the fast lane, as online grocery sales are growing quickly in the U.S. thanks to a growing list of same-day delivery options.  The most powerful trends on the internet include access via wireless devices, the migration of entertainment, including TV programming, to the web and cloud-based software-as-a-service.

Key Findings:

  • Plunkett Research lists top 450 companies in the E-Commerce & Internet Industry and names the top trends changing for the mid term.

Available Formats:

  • Printed Almanac: 978-1-62831-465-6 ISBN (Available Now)
  • E-book: 978-1-62831-770-1 ISBN (Available Now)
  • Online Subscription


Key Features Include:

  • Industry trends analysis, market data and competitive intelligence
  • Market forecasts and Industry Statistics
  • Industry Associations and Professional Societies List
  • In-Depth Profiles of hundreds of leading companies
  • Industry Glossary
  • Link to our 5-minute video overview of this industry

Pages:   674          

Statistical Tables Provided: 14

Companies Profiled: 495

Geographic Focus: Global

Price: $379.99

Key Questions Answered Include:

  • How is the industry evolving? 
  • How is the industry being shaped by new technologies? 
  • How is demand growing in emerging markets and mature economies?
  • What is the size of the market now and in the future?
  • What are the financial results of the leading companies?
  • What are the names and titles of top executives?
  • What are the top companies and what are their revenues?

This feature-rich book covers competitive intelligence, market research and business analysis—everything you need to know about the e-commerce & internet business including:   

  1. Bricks, Clicks and Catalogs Create Synergies While Online Sales Growth Surges                 
  2. Wi-Fi Enables Wireless Traffic Growth          
  3. Global Internet Market Tops 4.0 Billion Users/Ultrafast Broadband Expands, both Fixed and Wireless                       
  4. HTML5 Makes Web Pages More Interactive, Sets up the Semantic Web 3.0 of the Future
  5. China Is the World’s Largest Ecommerce Market and Continues to Boom  
  6. Social Media Generates $36 Billion in Global Online and Mobile Ad Revenues                   
  7. Digital Advertising Soars, Has Larger Share of U.S. Advertising Market Than TV     
  8. Online Travel Agencies (OTAs) Continue Strong Growth in Bookings/Hotels Fight to Keep Control of the Customer 
  9. Apple’s iTunes Set the Standard in the Music Industry, but Digital Sales Slow
  10. Pandora and Spotify Lead in Streaming Music Via Internet Radio but Face New Challenge from Apple Music/SiriusXM Tops 32 Million Subscribers
  11. Cable and Satellite TV Struggle With Cord-Cutting/Cheaper Streaming Options Proliferate, Including Netflix
  12. Quality of Care and Health Care Outcomes Data Are Available Online, Creating a New Level of Transparency 
  13. Online Banking Grows on Smartphones/The Internet and ATMs Replace Branches and Tellers
  14. Designers and Manufacturers Bypass the Middleman with Direct-to-Consumer Online Business Models           
  15. Light-Weight Satellites and Project Loon Balloons Studied for Internet Access and Whole-Earth Imaging
  16. “Sharing Economy” Gains Market Share in Travel with Online Sites Like Airbnb, HomeAway and Many Global Competitors    
  17. Digital Assistants Include Amazon’s Echo and Google’s Home/Alexa and Similar Software Power Third-Party Developers

E-Commerce & Internet Industry Statistics

  1. E-Commerce & Internet Business Statistics and Market Size Overview
  2. Estimated Quarterly U.S. Retail Sales, Total & E-Commerce: 1st Quarter 2008-3rd Quarter 2017
  3. E-Commerce Related Services Quarterly Revenue, U.S.: 2016-2017
  4. U.S. Retail Trade Sales, Total & E-commerce: 2014-3rd Quarter 2017
  5. Total & E-commerce Sales for Electronic Shopping & Mail-Order Houses, By Merchandise Line, U.S.: 2014-3rd Quarter 2017
  6. Internet Publishing & Broadcasting & Web Search Portals: Estimated Revenue & Expenses, U.S.: 2012-2017
  7. Internet Access Technologies Compared
  8. Number of Business & Residential High Speed Internet Lines, U.S.: 2011-2017
  9. Home Broadband Adoption Demographics, U.S.: November 2016
  10. Smartphone Dependency Demographics, U.S.: 2016           
  11. Internet Users by Demographic Group, U.S.: 2018
  12. Amazon.com, Inc. Annual Sales & Income: 2011-2017
  13. eBay Annual Statistics: 2012-2017    
  14. Employment in E-commerce & Internet-related Fields, U.S.: 1998-2017

Companies Mentioned Include:

  • Xaxis
  • 1-800 Contacts Inc
  • 1-800-Flowers.com Inc
  • Adobe Systems Inc
  • Automatic Data Processing Inc (ADP)
  • A B Watley Group Inc
  • About Inc
  • Acxiom Corp
  • AdStar Inc
  • ADTRAN Inc

What You get

Complete data and market research for the industry(s) of your choice, including:

  • Market Research
  • Technologies Analysis
  • Business Intelligence and “hard-to-find” facts
  • Key Industry Associations (with contact information)
  • Corporate Executive Contracts
  • Industry Glossary
  • Data Export Tools
  • Top Companies Data