Company Financial Analysis and Research, KPIs Financial Statements, Benchmarks and Ratios. Industry Market Size, Ranks, Growth Rate and Forecast.

Zendesk Inc (ZEN:NYS): Analytics, Extensive Financial Metrics, and Benchmarks Against Averages and Top Companies Within its Industry (NAIC )

Average Revenues, U.S.
Publicly-Held Companies in
this Industry, Latest Year
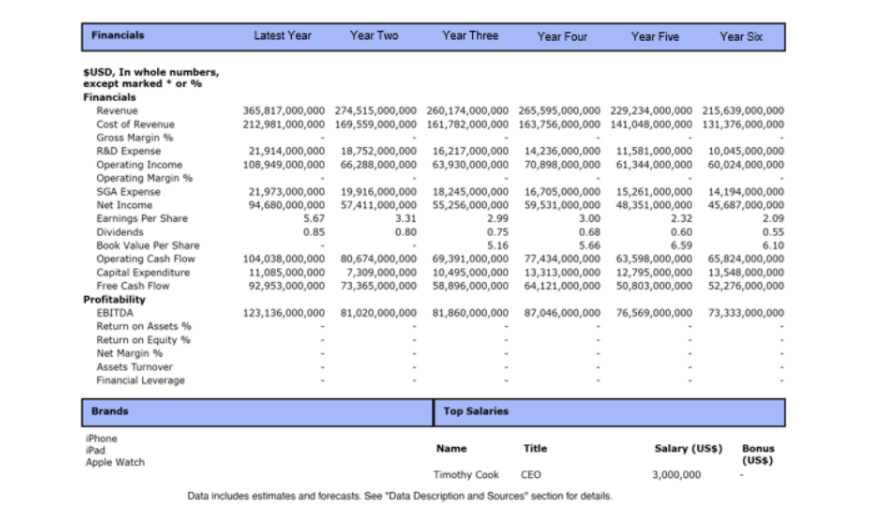
Cash Flow Statement
Averages, Target
Company and Industry Averages
Balance Sheet Analysis and
Averages, Target Company
and Industry Averages
Average Profits, U.S.
Publicly-Held Companies in
this Industry, Latest Year
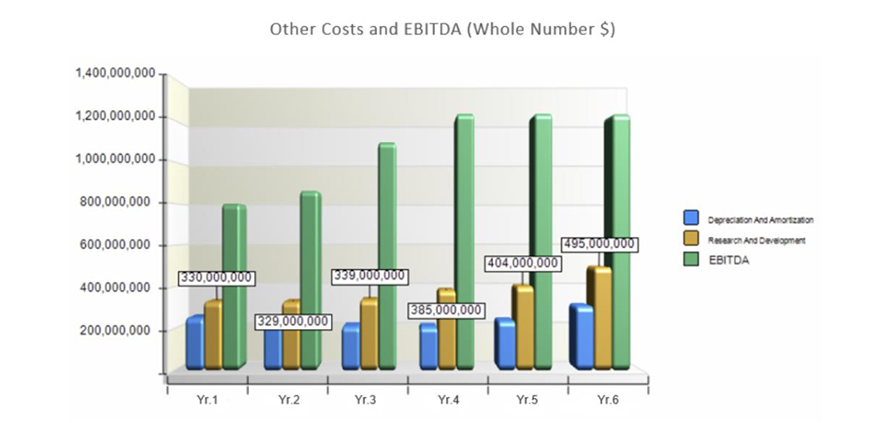
EBITDA, Target
Company and Industry Averages
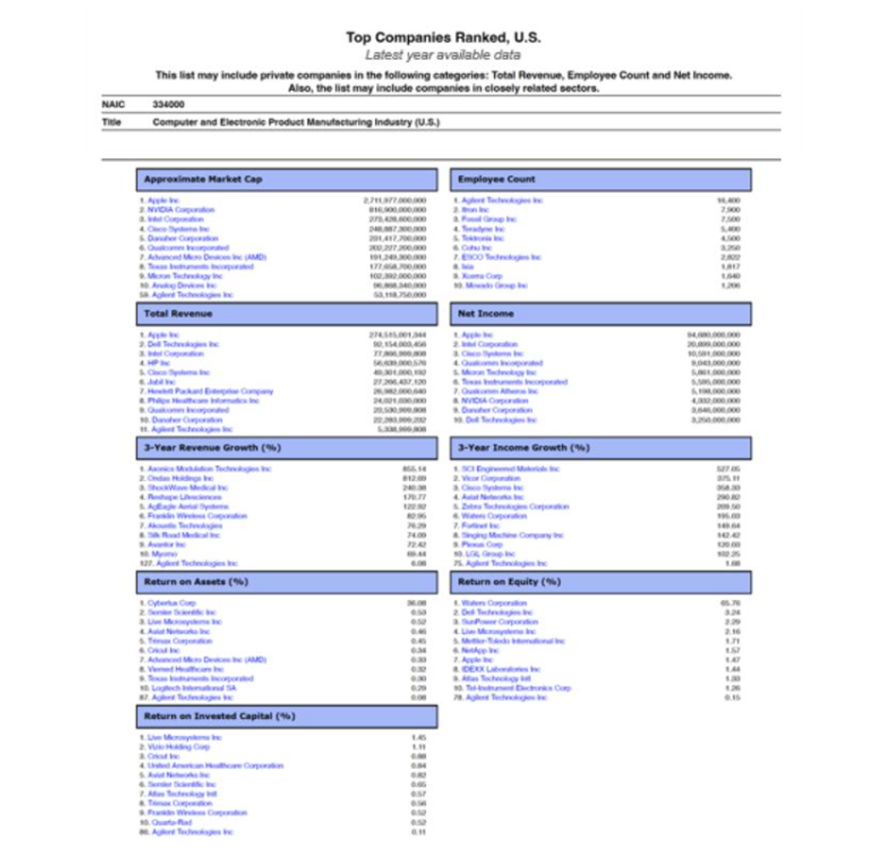
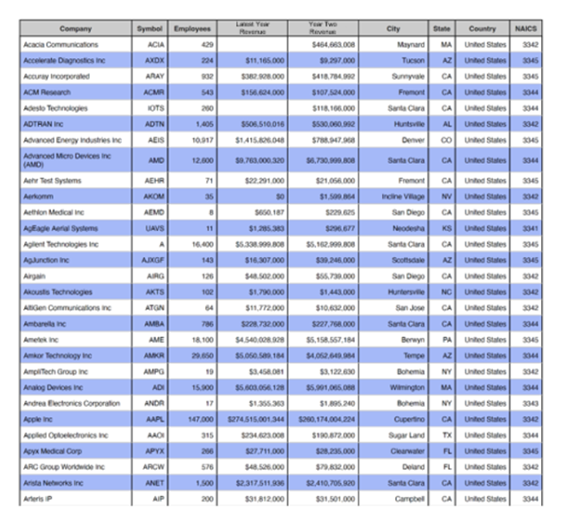
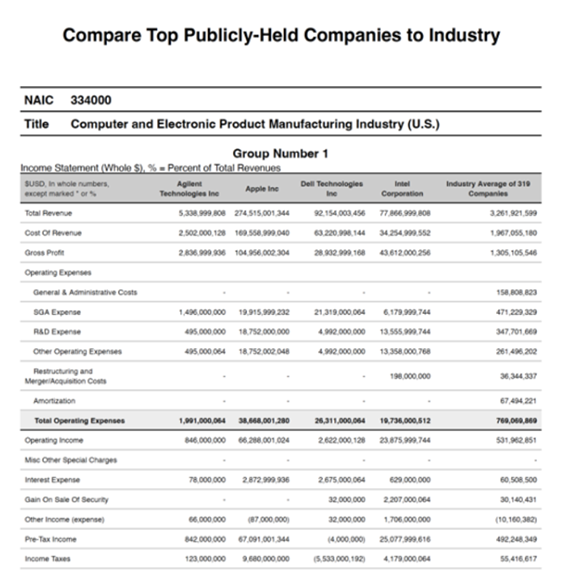
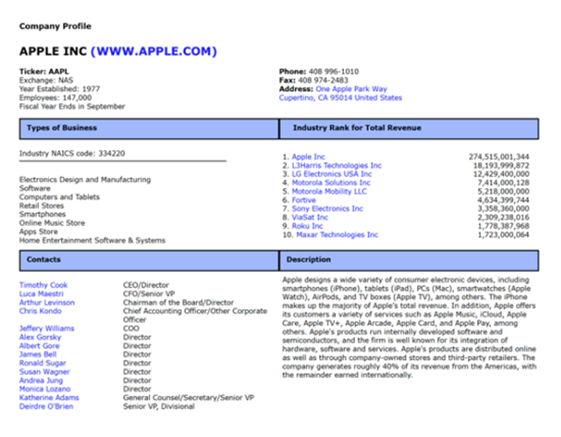
Top Competitors Ranked
XXXXX

This Financial Analysis & Benchmarks Report Was Published on 6/28/2021 and Includes:

  • Comprehensive benchmarks for Zendesk Inc (ZEN) : Benchmarked against the leading firms in its primary industry, Benchmarked against the average for publicly-held companies (U.S.) in its industry, This includes financial results, ratios, vital statistics and metrics in one package with historical and current metrics and averages for 6 years within its primary industry.
  • A snapshot overview of the company's primary industry, including current and historic revenues and employment, along with a long term forecast for industry growth, with CAGR (compound annual growth rate), employee population and much more.
  • Detailed rankings of Zendesk Inc (ZEN) against top companies within the industry (U.S.-based firms) for key items including Approximate market capitalization, Employees, Revenues, Net income, 3-Year revenue growth (%), 3-Year income growth (%), Return on assets (%), Return on equity (%), Return on invested capital (%).
  • Leading Competitors—profiles of the Zendesk Inc (ZEN) as well as profiles of top competitors within the industry

Select Format:

PDF Download, for Company or Organization-Wide Use, Multi-User$4,995.00
PDF Download, Single-User$1,995.00
Business Analysis, Benchmarks and Sample Report

OVERVIEW

Zendesk Inc (ZEN is benchmarked against industry averages AND competitors, including:

  • Adobe Inc
  • Cerner Corporation
  • Disney Parks, Experiences and Products (DPEP)
  • Electronic Arts Inc (EA)
  • Intuit Inc
  • Microsoft Corporation
  • Oracle Corporation
  • salesforce.com Inc
  • VMware Inc

Note: Short video is coming soon!

Table of Contents

I. Introduction
A. Core Benefits to Customer:
- Comprehensive financial performance benchmarking, including, in one package, the Subject Company's
1) Financial results
2) Financial history
3) Ratios
4) Vital metrics
- Industry-specific comparative financial analysis and benchmarking of the Subject Company to:
1) Deep financials of each of the leading firms in the Subject Company's primary industry
2) Detailed, multi-year financial averages for all companies within the industry
3) Rankings of the Subject Company against the top ten companies within the industry
- Profiles of the Subject Company and of its industry's leading firms
II. Industry Analysis Summary of the Subject Company's Primary Industry
- Industry revenues, employee count and growth rate
- Top U.S. companies, by revenues (table)
- Industry revenues, current and historical (chart)
- Industry employee population, current and historical (chart)
- Industry revenue yearly history and forecast with yearly CAGR
III. Industry Revenues, Historical and Projected
- Historical revenues and annual growth rates
- Projected revenues & annual growth rates
IV. Comparative Financial Benchmarks for the Subject Company by Industry Averages in a 6-year Time Series of Detailed Financials
A. Detailed table of companies used in computing these averages
B. Income statement averages
- All income statement items, including cost of sales, SGA, R&D, salaries and wages, and EBITDA, with ratios
- Chart showing average company's key expenses as a percent of revenues
C. Balance sheet averages
- All items, including property plant and equipment; accumulated depreciation; goodwill; and long term debt, including ratios
D. Cash flow averages
- All cash flow items
V. Competitive Summary of Top Companies Within the Industry, Profiles & Ranks
Profiles, financial reports, ranks & executive lists for up to 10 top U.S.-based corporations
A. Top companies within the industry ranked for key performance items
- Approximate market capitalization
- Employees
- Revenues
- Net income
- 3-Year revenue growth (%)
- 3-Year income growth (%)
- Return on assets (%)
- Return on equity (%)
- Return on invested capital (%)
B. Benchmarking of the Subject Company and its industry's leading firms to each other and to their industry's averages for all financial analysis metrics
- Income statements, balance sheets and cash flow statements for the Subject Company and for each of the top companies compared to each other and to the overall industry average
C. Corporate profiles, comparative analysis of the Subject Company and of the top companies within its industry, including executive listings and financial results
- Contact information, executive lists
- Business descriptions
- Key financial data for 6 years
- Brands and divisions
- Top salaries
- Corporate culture
- Charts comparing revenues vs. net income
VI. Data Description, Limited Warranty, Copyrights and Sources

Benchmarks