Non-Apparel Textiles (including Sheets, Towels, Rugs, Carpets, Rope and Twine) Mills and Manufacturing Industry Industry (U.S.): Analytics, Extensive Financial Metrics, Benchmarks Against Averages and Top Companies Within Its Industry, and Revenue Forecasts to 2030, NAIC 314000
Vital industry-specific data including metrics, benchmarks, historic numbers, growth rates and forecasts that will save countless hours of research.
Key Findings: -Non-Apparel Textiles (including Sheets, Towels, Rugs, Carpets, Rope and Twine) Mills and Manufacturing Industry Industry (U.S.) to reach $42,301,853,839 by 2030. -Non-Apparel Textiles (including Sheets, Towels, Rugs, Carpets, Rope and Twine) Mills and Manufacturing Industry Industry (U.S.), including Average EBITDA, Operating Ratios and Sales per Employee.
Core Benefits to Customer: 1) Comprehensive overview of an industry financial results, ratios, vital statistics and metrics in one package 2) Complete benchmarking of the industry and its top companies 3) Deep
READ MORE
Non-Apparel Textiles (including Sheets, Towels, Rugs, Carpets, Rope and Twine) Mills and Manufacturing Industry Industry (U.S.): Analytics, Extensive Financial Metrics, Benchmarks Against Averages and Top Companies Within Its Industry, and Revenue Forecasts to 2030, NAIC 314000
Vital industry-specific data including metrics, benchmarks, historic numbers, growth rates and forecasts that will save countless hours of research.
Key Findings:
-Non-Apparel Textiles (including Sheets, Towels, Rugs, Carpets, Rope and Twine) Mills and Manufacturing Industry Industry (U.S.) to reach $42,301,853,839 by 2030.
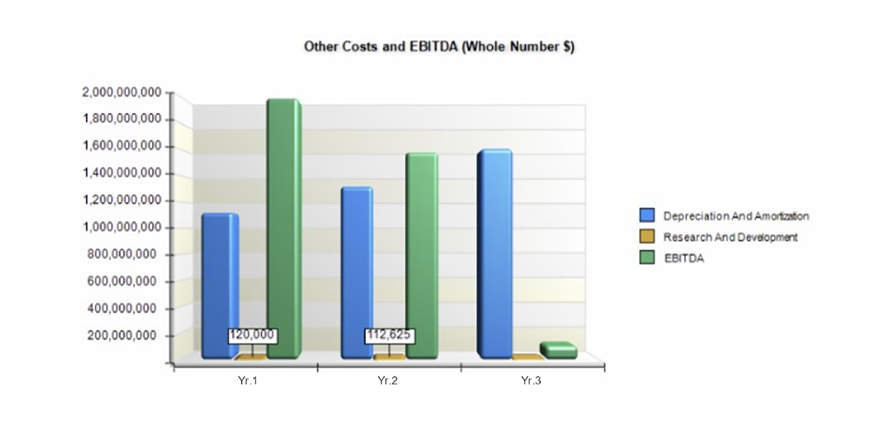
-Non-Apparel Textiles (including Sheets, Towels, Rugs, Carpets, Rope and Twine) Mills and Manufacturing Industry Industry (U.S.), including Average EBITDA, Operating Ratios and Sales per Employee.
Core Benefits to Customer:
1) Comprehensive overview of an industry financial results, ratios, vital statistics and metrics in one package
2) Complete benchmarking of the industry and its top companies
3) Deep industry and company financials
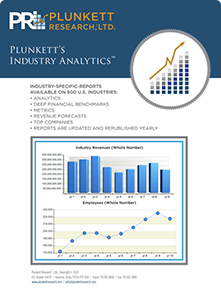
This Plunkett Analytics Report Features:
1) Historical data
2) Revenue forecasts, growth rates and CAGR
3) Operating ratios
4) Complete data for benchmarking a company to its industry and to specific leading companies
5) Benchmarking this industry to all U.S. industries
6) Deep profiles and financial histories/operating ratios for up to ten top U.S.-based companies
Pages: 51
Statistical Tables Provided: 33
Charts Provided: 21
Geographic: US
Designed to benefit:
- Analysis and Financial Modeling
- Investment Professionals
- Lenders
- M&A Advisors
- Appraisers
- Consultants
Similar reports are available from Plunkett Research for nearly all U.S. industries.
"Plunkett Research has built a solid reputation providing industry analysis and research in a diverse spectrum of areas-energy and utilities, finance and investment, health care and biotechnology, and engineering and research to name a few." American Reference Books Annual
Key Data:
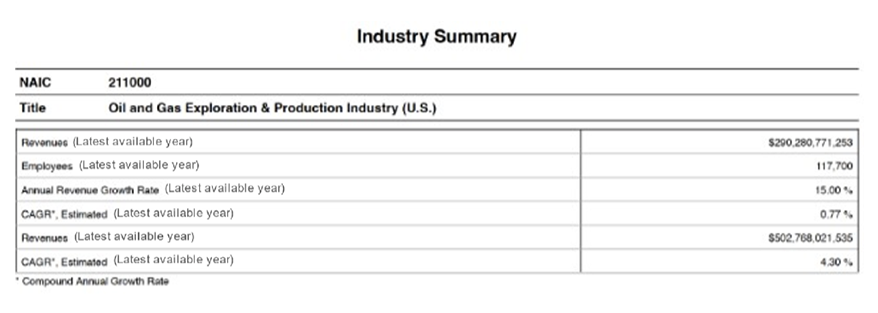
Industry Summary
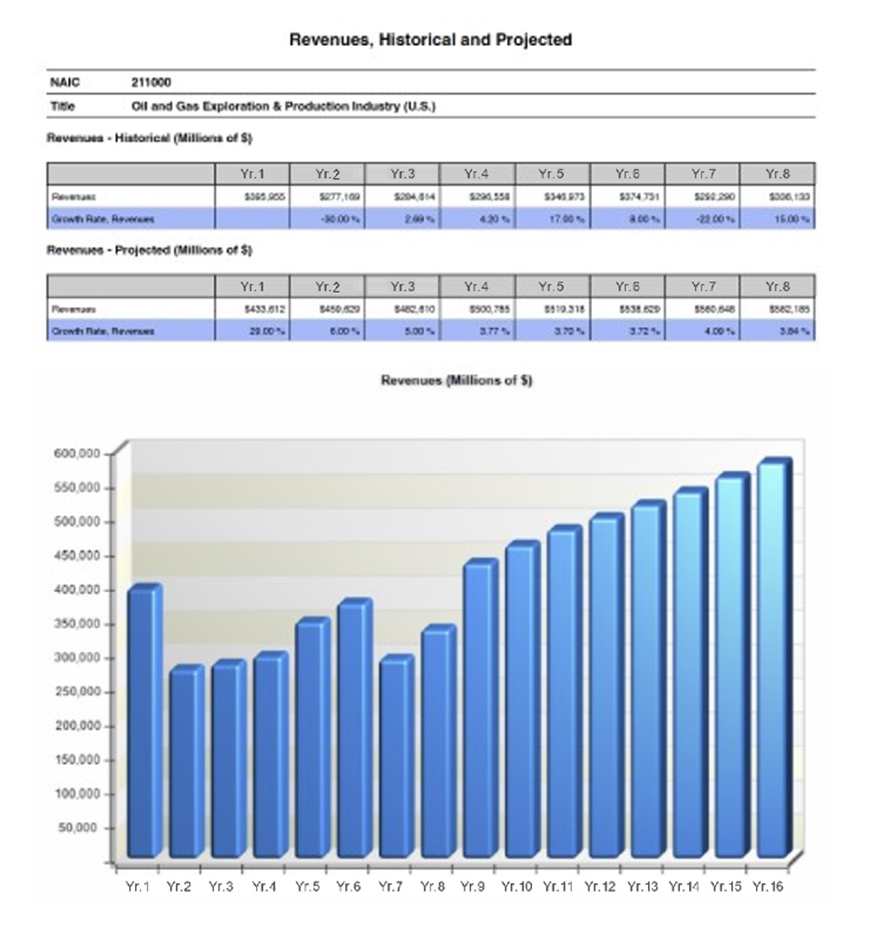
- Revenues historical through 2022
- Revenues projected through 2030
- Employee Count 2015-2022
- Annual Growth Rate 2022
- CAGR 2015 through 2022
- CAGR 2022 through 2030
- Top U.S. Companies
Employment and Establishments
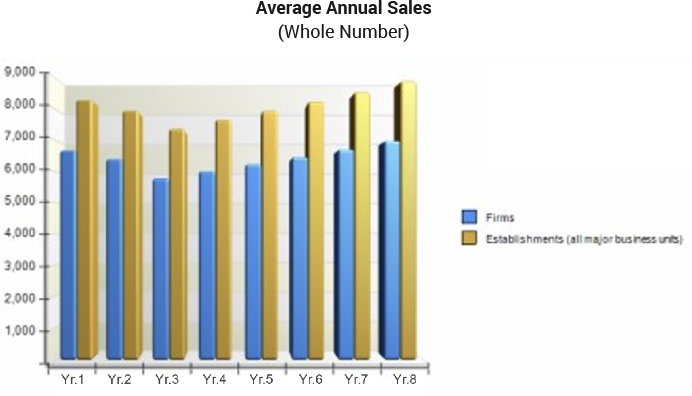
- Number of Firms 2015-2022
- Number of Establishments 2015-2022
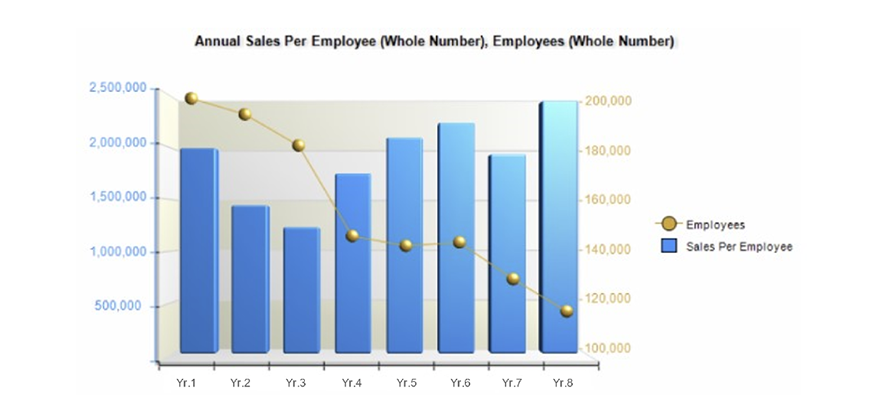
- Employees, 2015-2022
- Average Annual Sales per Firm & per Establishment 2015-2022
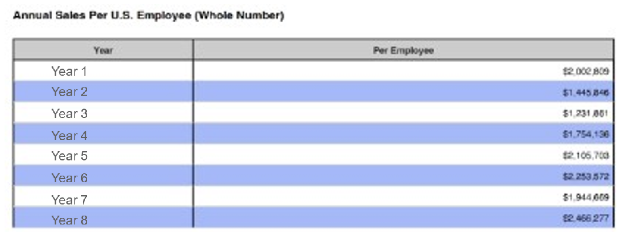
- Sales per Employee Average Annual Operating Ratios
- Revenue Compared to All Industries
- Expenses Compared to All Industries
- Profits & Income Taxes Compared to All Industries
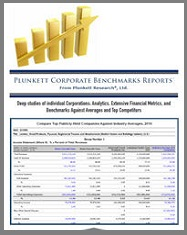
Benchmarks
This Industry Compared to All Industries
- Comparison of Revenues, Profits and Taxes to All Industries
Industry Results, Publicly-Held Companies Industry (U.S.), Average for all Companies
- Industry Income Statement, Balance Sheet, Cash Flow Statement, 2015-2022
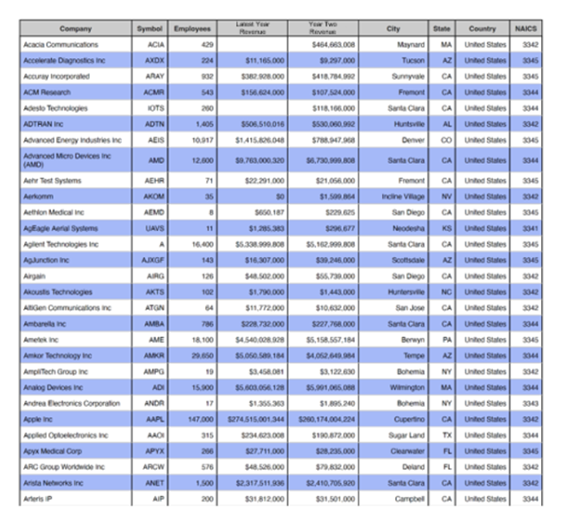
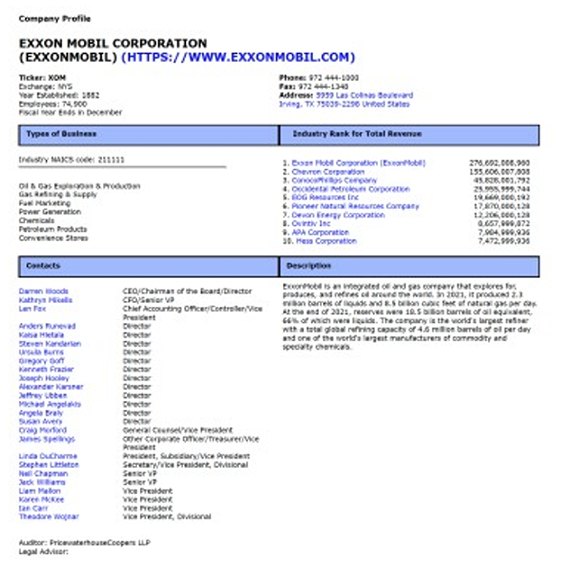
Top Companies Profiled & Ranked
- In-Depth Profiles, Financial Reports, Ranks & Executive Lists for Top U.S.-Based Corporations
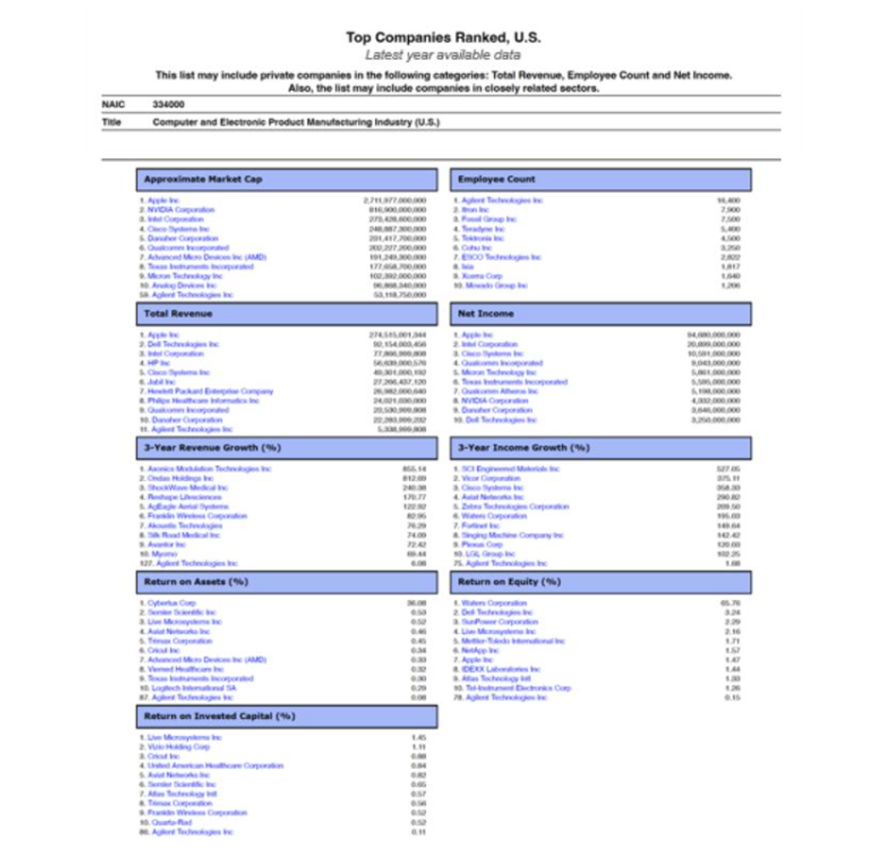
Top Companies Ranked
- Market Capitalization
- Employees
- Revenue
- Net Income
- 3-Year Revenue Growth
- 3-Year Income Growth
- Return on Assets
.- Return on Equity
- Return on Invested Capital
List of Leading (Public and Private) Companies
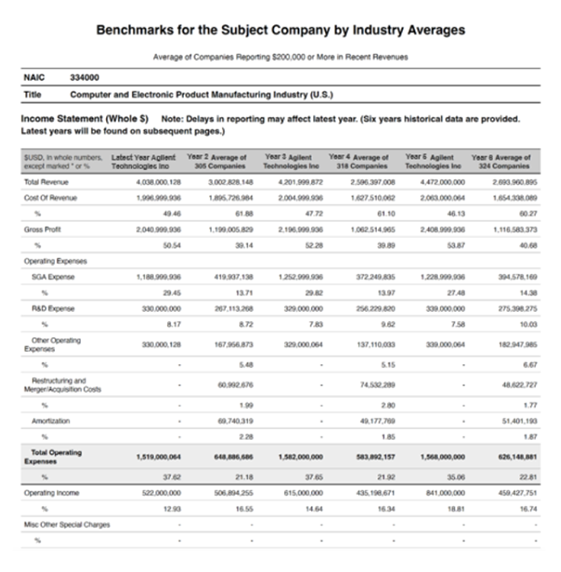
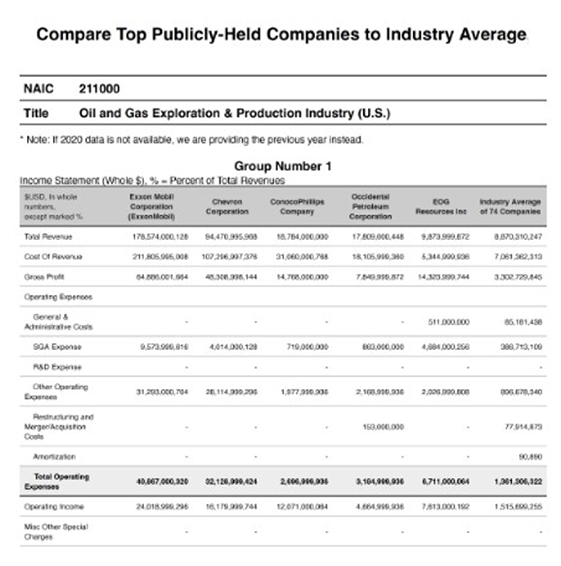
Comparison of Individual Top Publicly-Held Companies to Industry Averages, 2022
- Income Statements, Balance Sheets and Cash Flow Stat
- Companies Profiled: -Mohawk Industries Inc -Interface Inc -Dixie Group Inc -Kona Gold Solutions


 Download Corporate Benchmarks Brochure