Market Research, Business Intelligence and Opinion Polling Industry (U.S.) Revenues Market Size Forecasts Benchmarks Analysis

(Includes complete industry benchmarks for income, cash flow, balance sheet and more)

OVERVIEW

Market Research, Business Intelligence and Opinion Polling Industry (U.S.): Analytics, Extensive Financial Metrics, Benchmarks Against Averages and Top Companies Within Its Industry, and Revenue Forecasts to 2028, NAIC 541910 Vital industry-specific data including metrics, benchmarks, historic numbers, growth rates and forecasts that will save countless hours of research. Key Findings: – Market Research, Business Intelligence and Opinion Polling Industry (U.S.) to reach $27,968 million by 2028. – Market Research, Business Intelligence and Opinion Polling Industry (U.S.), including Average EBITDA, Operating Ratios and Sales per Employee. Core Benefits to Customer: 1) Comprehensive overview of an industry’s financial results, ratios, vital statistics and metrics in one package 2) Complete benchmarking of the industry and its top companies 3) Deep industry and company financials This Plunkett Analytics Report Features: 1) Historical data 2) Revenue forecasts, growth rates and CAGR

READ MORE

Includes Details on the Following Companies, as well as Benchmarks for the Entire Industry:

  • Forrester Research Inc
  • Gartner Inc
  • Information Resources Inc (IRI)
  • JD Power
  • Nielsen Holdings plc
 

Table of Contents

I. Introduction
A. Core Benefits to Customer:
- Comprehensive overview of an industry's financial results, ratios and vital metrics in one package (U.S. data)
- Benchmarking of:
1. Deep financials of each of the leading companies in the industry
2. Multi-year financial averages for all companies in the industry
3. This industry's financial ratios compared to all other industries.
- Historical revenues
- Enterprise population
- Multi-year employee count and sales per employee
- Current and forecast revenues and CAGR to 2028
- Profiles of the industry's leading firms, with multi-year financial histories

II. Industry Description for this NAIC Code
- Types of business activities

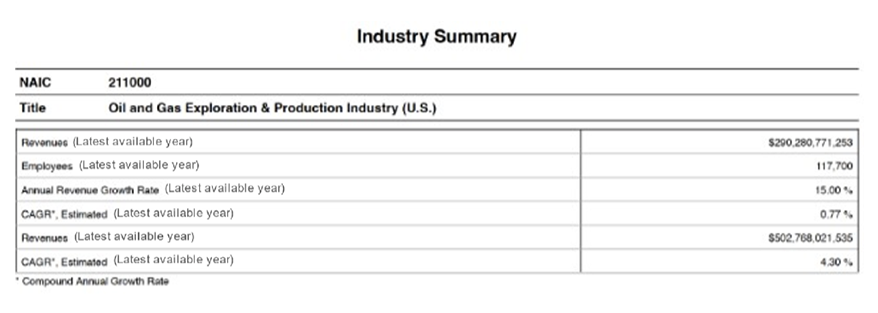
III. Industry Summary, Current Year (U.S. Data)
- Revenues and CAGR 2021
- Revenue forecast to 2028 with CAGR
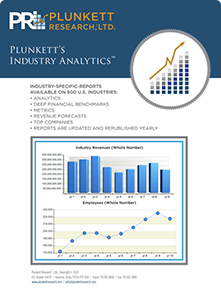
- Historical revenues
- Historical CAGR
- Top U.S. companies, by revenues
- Employment within the industry, 2020 and historic

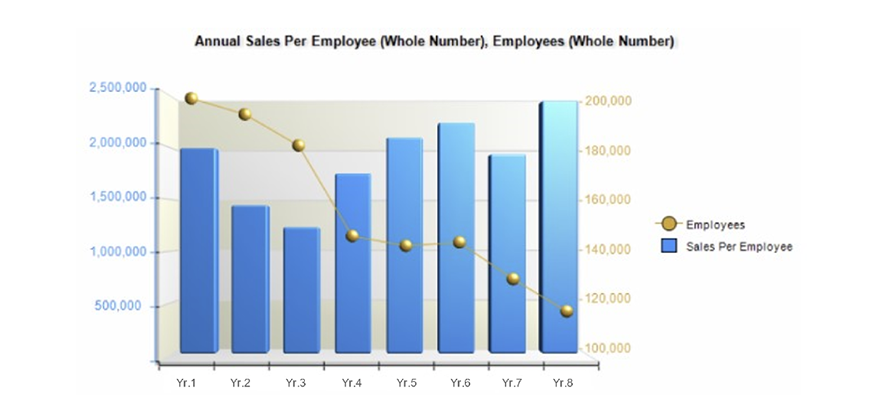
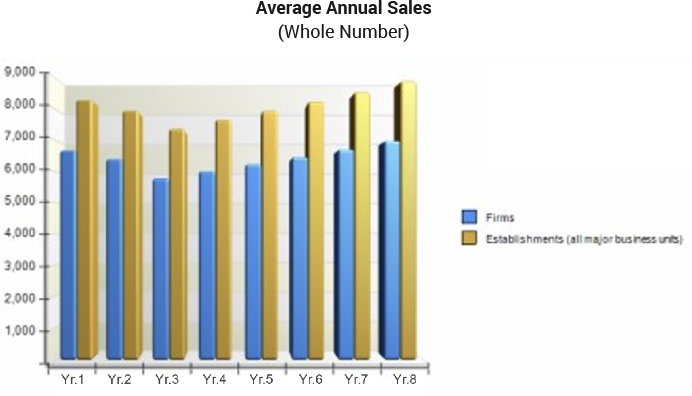
IV. Employment and Establishment Count (U.S. Data)
- Number of firms and establishments, 2013-2020
- Employees, 2013-2020, with growth rates
- Average annual sales per firm and per establishment, 2013-2020
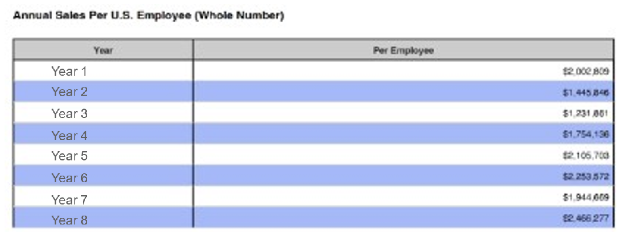
- Annual sales per employee, 2013-2020

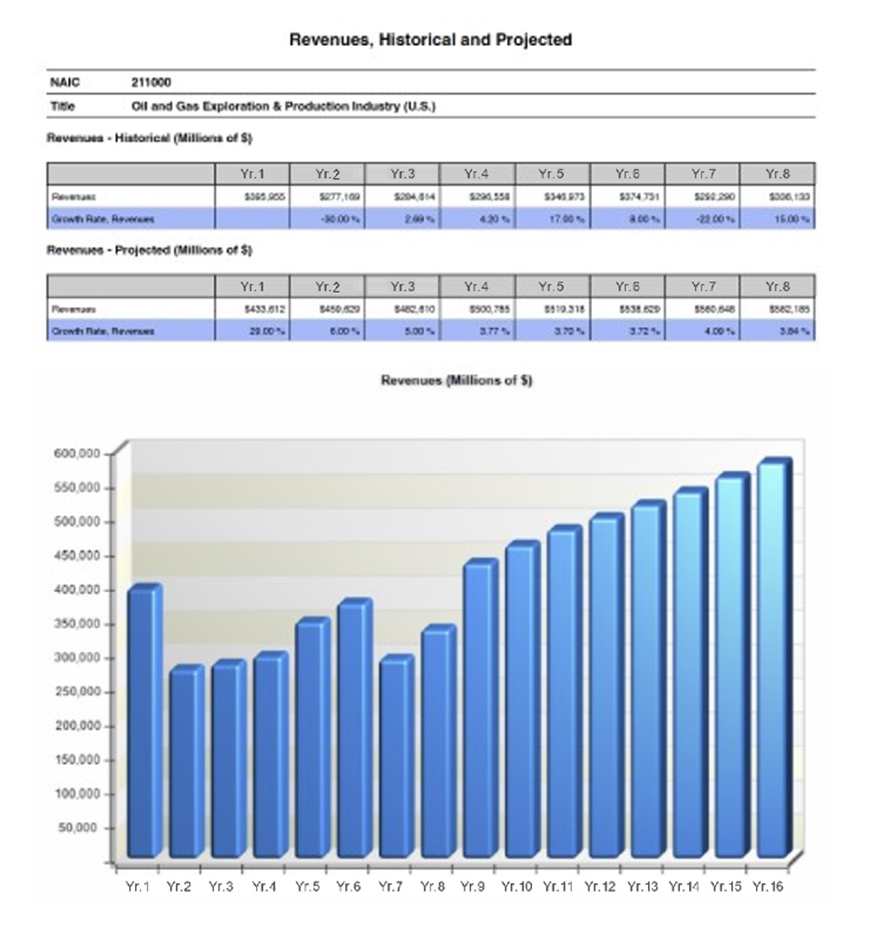
V. This Industry's Financial Data, U.S., With Revenue Projections to 2028

A. Revenues, Historical and Projected
- Historical revenues & CAGR growth rates, 2013-2021
- Projected revenues & CAGR growth rates, 2021-2028

B. Average Annual Operating Ratio Estimates and Benchmarks for Current Year
- Income items, expenses, profits and taxes as a percent of total revenues for this industry

C. This Industry Compared to All Industries, Benchmarks for Current Year

- Comparison of revenues for this industry to total revenues for all industries
- Comparison of EBITDA, profits and income taxes for this industry to the same items in total for all industries

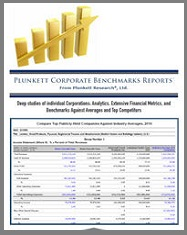
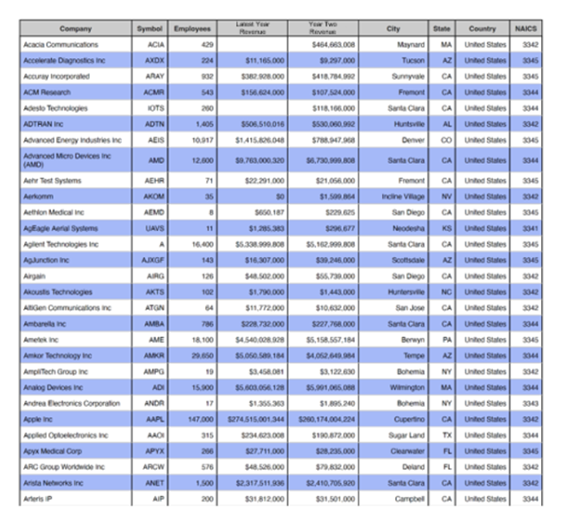
D. Table of Companies Used in Creating Industry Averages
- Detailed, alphabetical listing of companies, with revenues, location, ticker symbol and exchange

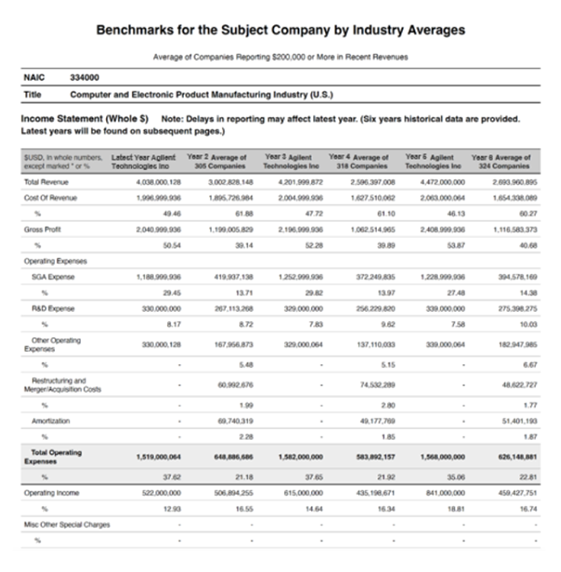
E. Industry Results and Benchmarks for Publicly-Held Companies
- Income statement averages, 2014-2020
- All income statement items, including, cost of sales, SGA, R&D, salaries and wages, and EBITDA, with ratios
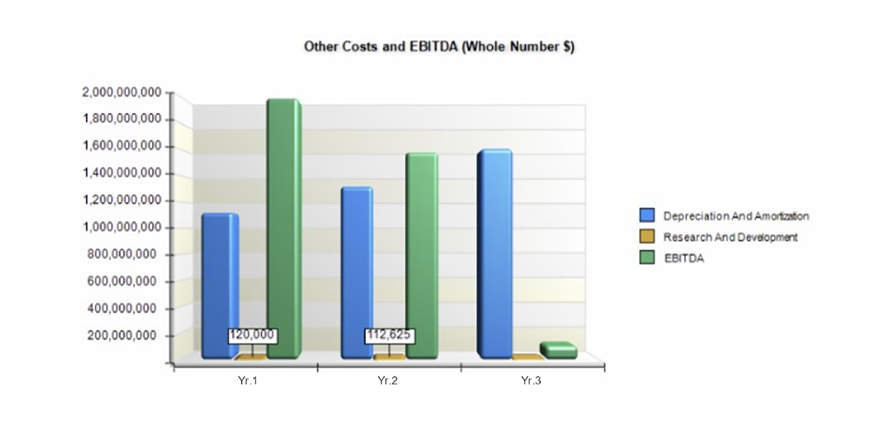
- Chart showing key expenses as a percent of revenues
- Balance sheet averages, 2014-2020
- All items, including property plant and equipment, accumulated depreciation, goodwill, and long term debt, including ratios
- Cash flow averages, 2013-2018
- All cash flow items

VI. Top Companies Profiled & Ranked
- In-depth profiles, financial reports, ranks & executive lists for up to 10 top U.S.-based corporations

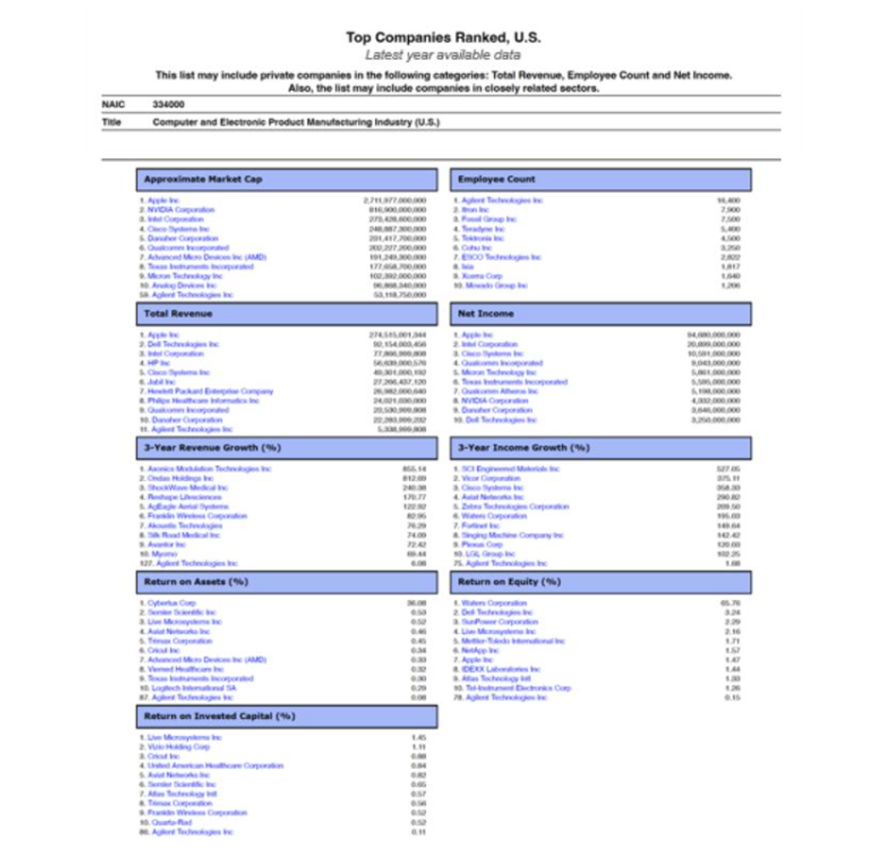
A. Top Companies Ranked for Key Items:
- Approximate market capitalization
- Employees
- Revenues
- Net income
- 3-Year revenue growth rate
- 3-Year income growth rate
- Return on assets rate
- Return on equity rate
- Return on invested capital rate

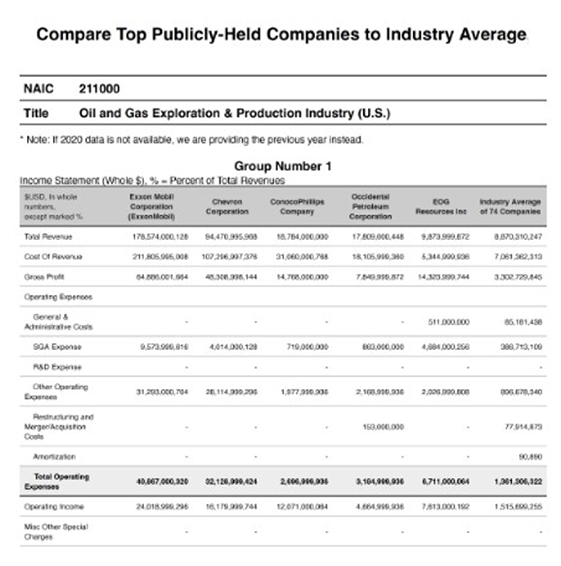
B. Benchmarking of the Industry's Top Companies, to Each Other and to their Industry's Averages for All Metrics
- Income statements, balance sheets and cash flow statements for each of the top companies compared to the industry's overall average

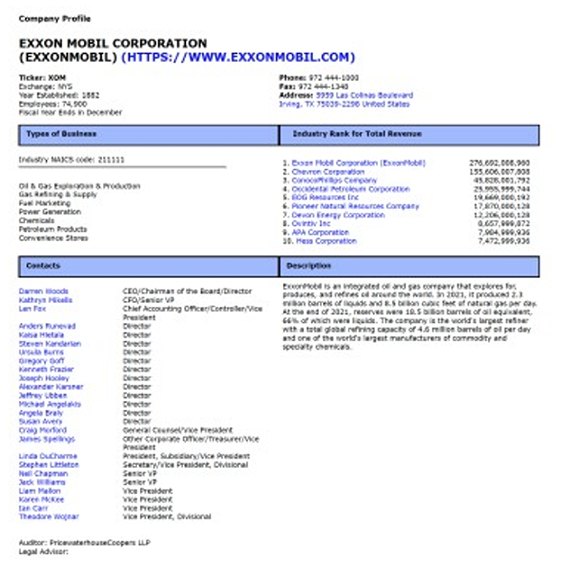
C. Corporate Profiles (Descriptions of the Top Companies Within the Industry, Including Executive Listings and Multi-Year Financial Results)
- Contact information, executive lists
- Business descriptions
- Key financial data for 6 years
- Brands and divisions
- Top salaries
- Corporate culture
- Charts comparing revenues vs. net income

VII. Appendix: Assumptions
- U.S. GDP Growth and Forecasts, 2016-2028

VIII. Data Description and Sources

Benchmarks: The target company is benchmarked against these peers:

This Industry Compared to All Industries
   - Comparison of revenues, EBITDA, profits & income taxes for all companies within this industry to all industries

Industry Results, for Publicly-Held Companies, 6-Year History
   - All income statement items, including, COGS, SGA, R&D, & EBITDA, with ratios
   - All balance sheet items
   - All cash flow items

Top Companies Profiled
   - In-depth rankings and profiles, financial reports and executive lists for up to 10 top U.S.-based corporations

Top Companies Ranked
   - Company ranks for: market capitalization, employees, revenues, net income, income growth, ROI, ROA, and ROIC

Comparison of Top Publicly-Held Companies to Industry Averages, Latest Year
   - Benchmark specific top companies to financial averages for income statements, balance sheets and cash flow statements

Analytics Reports Available on 500 Different U.S. Industries. UPDATED YEARLY.

Analytics Reports Available on 500 Different U.S. Industries

We solve data needs!

I Need Historic Market Growth
arrow icon
7-Year Histor
I Need Market Size Forecasts
arrow icon
7-Year Forecasts
I Need Financial Metrics, Averages and Operating Ratios
arrow icon
Complete Financial Metrics & Analytics
I Need Profit Margins and EBITDA
arrow icon
Profits, Margins, COGS, EBITDA
I Need Benchmarks for Top Firms
arrow icon
Top Firms Analyzed and Compared
I need Deep Data on a Niche Industry
arrow icon
Covering 500 Industry Sectors

Each 60 to 70 Page Report Starts With an Industry Summary, Historic Data and Forecasts

checkbox icon
Market Size by Revenues, Latest Year
checkbox icon
Growth-Rate, Latest Year
checkbox icon
CAGR Past 8 Years
checkbox icon
Market Size Projection 7 Years
checkbox icon
CAGR Next 7 Years
industry-summary
revenues

Sales Per Employee

Sales Per Employee

Sales Per Firm

Sales-Per-Firm
Sales Per Firm 2

Multi-Year Financial Averages for the Indudtry's

Multi-Year Financial Averages for the Industry’s

  • Income Statement
  • Balance Sheet
  • Cash Flow Statement
  • A Complete History!
benchmarks

Historic EBITDA

Historic EBITDA

Top Companies Ranked

Top Companies Ranked

Includes a List of Companies Used for Industry Averages

For hundreds of NAIC Industry Codes:

dot icon
Industry revenues
dot icon
Company count
dot icon
Employee count
dot icon
Historical revenues
dot icon
Benchmarks
dot icon
Financial metrics
dot icon
Revenue forecasts
superb company

Top Companies Compared to Each Other and to the Industry Average

  • Income Statement
  • Balance Sheet
  • Cash Flow Statement
Top Companies Compared to Each Other and to the Industry Average

For the Industry's Top Firms

  • Company Profile
  • Leadership
  • Historical Financials
  • Business Discussion
For the Industry's Top Firms

Buyers Include the World's top Consultancies, Corporations and Investment Firms

Plunkett Analytics Saves Countless Hours of Effort and Solves Unique Data Needs for Specific Types of Buyers

Banks and Other Lenders
checkbox-square icon
M&A Advisors and Appraisers
checkbox-square icon
Professionals at Investment Banks
checkbox-square icon
Consulting and Accounting Firms
checkbox-square icon
Private Equity Firms
checkbox-square icon
Analysts, Hedge Fund Professionals
checkbox-square icon
VP of Strategy Needing Deep, Industry -Specific Data
checkbox-square icon

Reports Available for All American Industries

Firms Covered by these Reports Include All Industry Sectors. Updated and Republished Frequently.

dot icon
Advertising, Branding & Marketing
dot icon
Aerospace, Satellites & Drones
dot icon
Airlines, Hotel & Travel
dot icon
Alternative & Renewable Energy
dot icon
Apparel, Textiles & Fashion
dot icon
Artificial Intelligence
dot icon
Automobiles & Trucks
dot icon
Banking, Mortgages & Credit
dot icon
Biotechnology, Drugs & Genetics
dot icon
Canadian Industries
dot icon
Chemicals, Coatings & Plastics
dot icon
InfoTech, Computers & Software
dot icon
Consulting
dot icon
Consumer Products & Services, Cosmetics, Household Products
dot icon
Cybersecurity
dot icon
E-Commerce & Internet
dot icon
Education
dot icon
Energy & Utilities
dot icon
Engineering & Research
dot icon
Entertainment & Media
dot icon
Fintech
dot icon
Food, Beverage & Tobacco
dot icon
Games, Apps & Social Media
dot icon
Green Technology
dot icon
Health Care
dot icon
Insurance
dot icon
International Companies
dot icon
Internet of Things
dot icon
Investment & Securities
dot icon
Manufacturing & Robotics
dot icon
Medical Devices & Technologies
dot icon
Metals
dot icon
Outsourcing & Offshoring
dot icon
Private Companies
dot icon
Restaurant & Hospitality
dot icon
Real Estate & Construction
dot icon
Retailing
dot icon
Sharing Economy,
dot icon
Freelance Workers,
dot icon
On-Demand Delivery Services
dot icon
Sports
dot icon
Telecommunications
dot icon
Transportation & Supply Chain
dot icon
Wireless, WiFi, RFID & Cellular

Vital Data, Great Prices, & the Outstanding Plunkett Brand

arrow icon
Each Report Covers 1 Industry
arrow icon
Updated and Republished Frequently
arrow icon
500 Reports Listed by NAIC and Industry Name

Learn More about Plunkett Research, Ltd. Products and Services

Select format

Dataset Download of Industry Forecasts, Sizing, Metrics and Histories for 500+ Industries, $25,000+ Yearly.